


 FxWirePro- Woodies pivot (Major)
  Gold Loses Steam After Strong U.S. Retail Sales
  Major Pair Action Bias: Extremely Bullish Surge Powers GBPUSD & NZDUSD as Bullish Momentum Ignites
  JPY Action Bias: Extremely Bullish Surge Ignites Across NZD, GBP & AUD
  FxWirePro- Major Crypto levels and bias summary
  GBPJPY Bullish Surge: Strong Pound Ignites Fresh Upside on Fed-BOE Policy Divergence as All EMAs Align
  FxWirePro: USD/ZAR advances as South African rand weakens amid renewed Middle East tensions


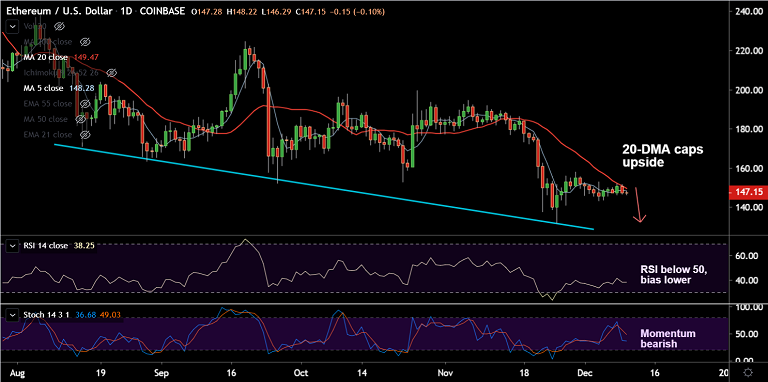
ETH/USD chart - Trading View
Exchange - Coinbase
Support: 141.35 (78.6% Fib); Resistance: 149.46 (20-DMA)
Technical Analysis: Bias Bearish
ETH/USD was trading rangebound on the day, at 147.03 at 04:55 GMT, after closing 2.24% lower in the previous session.
Upside in the pair was capped at 20-DMA on Monday's trade, which is offering stiff resistance at 149.46.
Major trend has been bearish and a 'Bearish Engulfing' pattern has raised scope for resumption of weakness.
Technical indicators are biased lower. RSI is below 50 and Stochs are biased lower. 5-DMA caps upside.
Volatility is shrinking and GMMA indicator shows shift in short-term MAs and Stochastics RSI is on verge of rollover from overbought levels.
Immediate support is seen at 141.35 (78.6% Fib). Break below will see dip till 131.80 (Nov 25 low).


