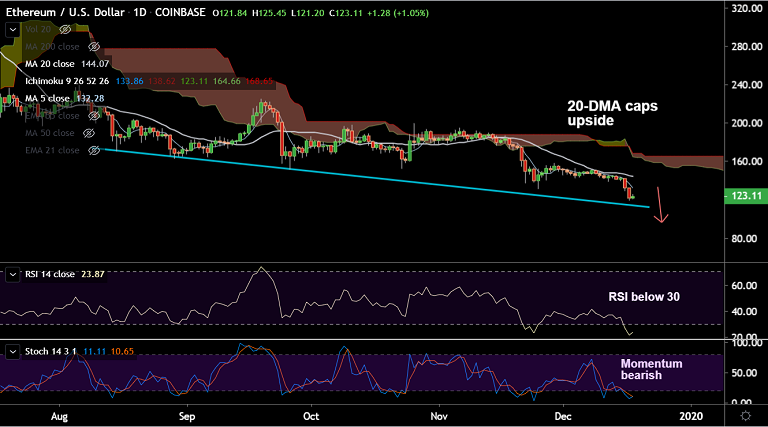
ETH/USD chart - Trading View
Exchange - Coinbase
Support: 114.50 (Trendline); Resistance: 125.86 (21H EMA)
Technical Analysis: Bias Bearish
ETH/USD is consolidating previous sessions losses on the day, bias remains bearish.
The pair was trading at 122.98 at 05:30 GMT, slightly lower from session highs at 125.45, up 0.98% at the time of writing.
Technical indicators are strongly bearish, no major signs of recovery seen on the charts yet.
Recovery attempts capped below 21H EMA (125.86), upside lacks traction. Scope for resumption of weakness.
Next major support aligns at 114.50 (Trendline). Break below could see drag till 112.96 (88.6% Fib).
Retrace above 5-DMA will see minor gains till 200H MA at 140.90. Decisive break above 20-DMA could change near-term dynamics.