


 FxWirePro- Major Crypto levels and bias summary
  FxWirePro- Major Crypto levels and bias summary
  FxWirePro: USD/ZAR gains as stronger dollar outweighs upbeat South Africa's trade surplus
  FxWirePro: GBP/AUD drifts lower after BOE rate decision
  FxWirePro: NZD/USD consolidates overnight gains, but loses momentum
  JPY Currency Meter Signals: NZDJPY Bullish (+25) vs CHFJPY (-100) – These Pairs Could Move Next
  US Magnificent 7 Stocks Trend Score: Amazon & Microsoft Hit Extreme Bullish (+100) as Meta Drops to -100 — Key Resistance & Support Watchlist
  Major European Indices Score Extremely Bullish: DAX Eyes 26000, CAC Targets 8600, FTSE100 at 11000 – Key Levels to Watch
  NZDJPY Bullish Rebound: Buy Dips as EMAs Align for 97 Target
  AUDJPY Volatile After Massive Sell-Off: Sell Rallies at 113, Targeting 110 as Bearish Momentum Surges


 - EconoTimes)


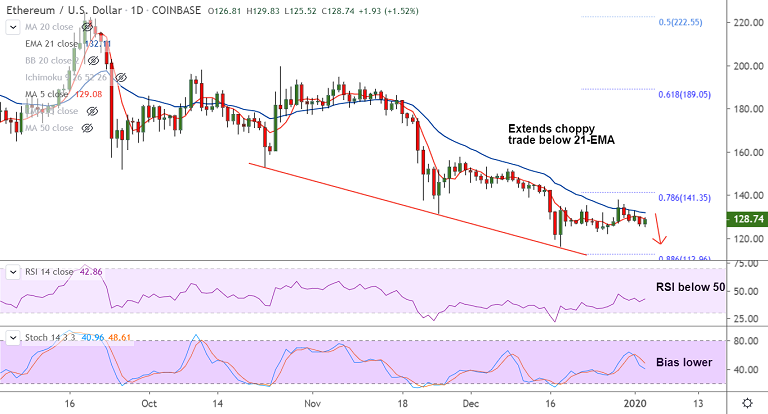
ETH/USD chart - Trading View
Exchange - Coinbase
Support: 133.57 (21-EMA); Resistance: 144.57 (55-EMA)
Technical Analysis: Bias Bullish
ETH/USD is extending break above 21-EMA, scope for further upside.
The pair was trading 3.16% higher on the day at 139.52 at 04:55 GMT, after closing 0.87% higher in the previous session.
On the weekly charts the pair has resumed upside after 'Hammer' and back-to-back 'Dragonfly Doji' formations.
Technical indicators have turned bullish and support further gains. Stochs and RSI are biased higher. Volatility is also rising.
Price action is extending break above 4H 200 MA, is on track to test next major hurdle at 55-EMA at 144.57.
Break above cloud will shift major bias to bullish. Retrace below 21-EMA will negate upside bias.


