


 BTC’s Bear Bounce: Sell the Rally Near $66K as Bears Target $59K–$52K Breakdown


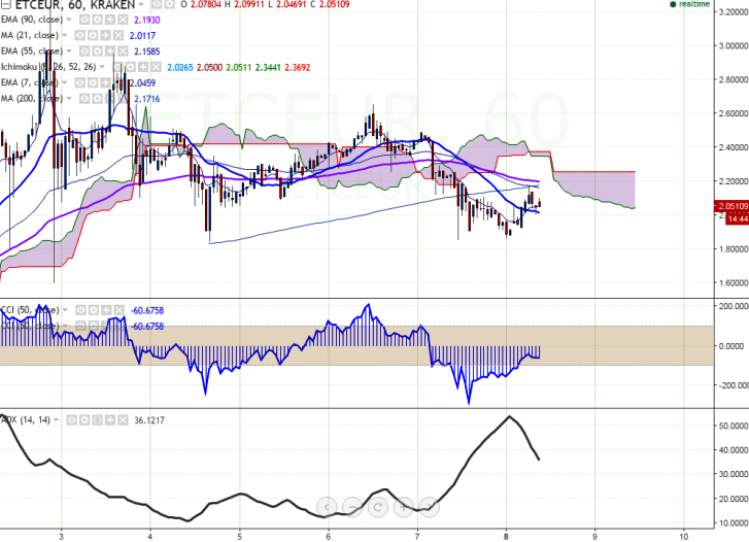
ETC/EUR jumped slightly above 200 HMA and declined from that level (KRAKEN). It is currently trading around 2.0461 at the time of writing.
Ichimoku analysis of hourly chart shows:
Tenkan-Sen level: 2.015
Kijun-Sen level: 2.055
Trend reversal level - (90 EMA)-2.196
Short-term trend remains to be bearish. The pair recovered till 2.17 at the time of writing from the low of 1.85. ETC/USD should break above 90-H EMA for further bullishness.
Any violation above 2.196 will take the pair to next level till 2.34 (61.8% retracement of 2.6499 and 1.85)/2.486/2.65 (Aug 6th 2016 high). On the lower side minor support is around 2 and break below targets 1.85 (Aug 7th low)/ 1.65 (161.8% retracement of 1.85 and 2.17).

- News

- Economy

- Central Banks
- Investing
- Research
- Roundups
- Digital Currency
- Insights
- Technical Analysis
- Technology
- Business
- Law
- Health
- Nature
- Fintech
- Science
- Topic
- Opinions
- ©Econometrics LLC . All Rights Reserved.
ETC/EUR struggles at 90-H EMA, break above targets 2.65
Monday, August 8, 2016 9:54 AM UTC
Editor's Picks


- Market Data
Most Popular


