


 FxWirePro- Major Crypto levels and bias summary
  FxWirePro- Major Crypto levels and bias summary
  FxWirePro- Major Crypto levels and bias summary
  BTC’s Bear Bounce: Sell the Rally Near $66K as Bears Target $59K–$52K Breakdown
  FxWirePro- Major Crypto levels and bias summary


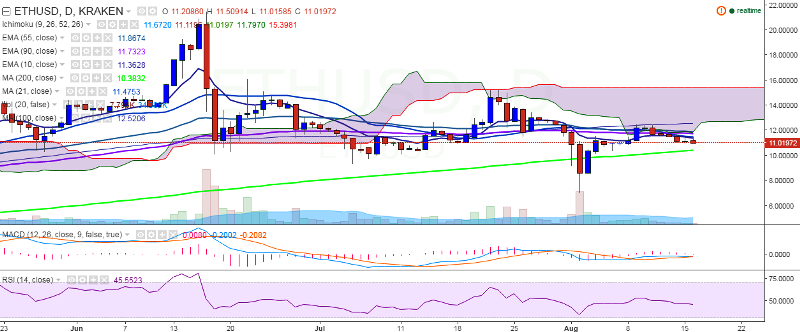
ETH/USD is trading in a narrow range on Tuesday between 11.07 and 11.50 levels. It is currently trading at 11.13 levels (Kraken).
Ichimoku analysis of daily chart:
Tenkan Sen: 11.65
Kijun Sen: 11.11
Trend reversal: 11.74 (90 EMA)
The pair’s upward move seems to be limited by 21 MA. On the topside, it faces major resistance at 11.74 levels 90 EMA) and it close above this level for further upside. A consistent break above this level would see the pair testing 12.50 (100-day MA) and then 13.44 (161.8% retracement of 12.49 and 10.94).
Short-term trend is bearish for the pair and it is likely to find support at 10.34 (200-day MA) and break below would drag the pair to 9.09 (61.8% retracement of 7 and 12.49)/7.00.

- News

- Economy

- Central Banks
- Investing
- Research
- Roundups
- Digital Currency
- Insights
- Technical Analysis
- Technology
- Business
- Law
- Health
- Nature
- Fintech
- Science
- Topic
- Opinions
- ©Econometrics LLC . All Rights Reserved.
ETH/USD trades flat, bullishness only above 90-day EMA
Tuesday, August 16, 2016 10:31 AM UTC
Editor's Picks


- Market Data
Most Popular


