


 J.P. Morgan Sees Potential Vestas Guidance Upgrade Amid Strong Wind Energy Demand
  World Cup technology: from ref cams to AI analysts, cutting-edge research is changing the game
  How AI prompting turned writerly description into an everyday skill
  Goldman Sachs: US Dollar Likely to Stay Strong Despite Oil Price Retreat
  SpaceX Stock Gets $175 Target as Analysts See Massive Growth Ahead
  How Donald Trump has changed the way diplomacy is done
  China’s AI Manufacturing Boom Masks Weak Consumer Economy, Citi Says
  Today’s space race could turn fatal if we don’t agree on new rules


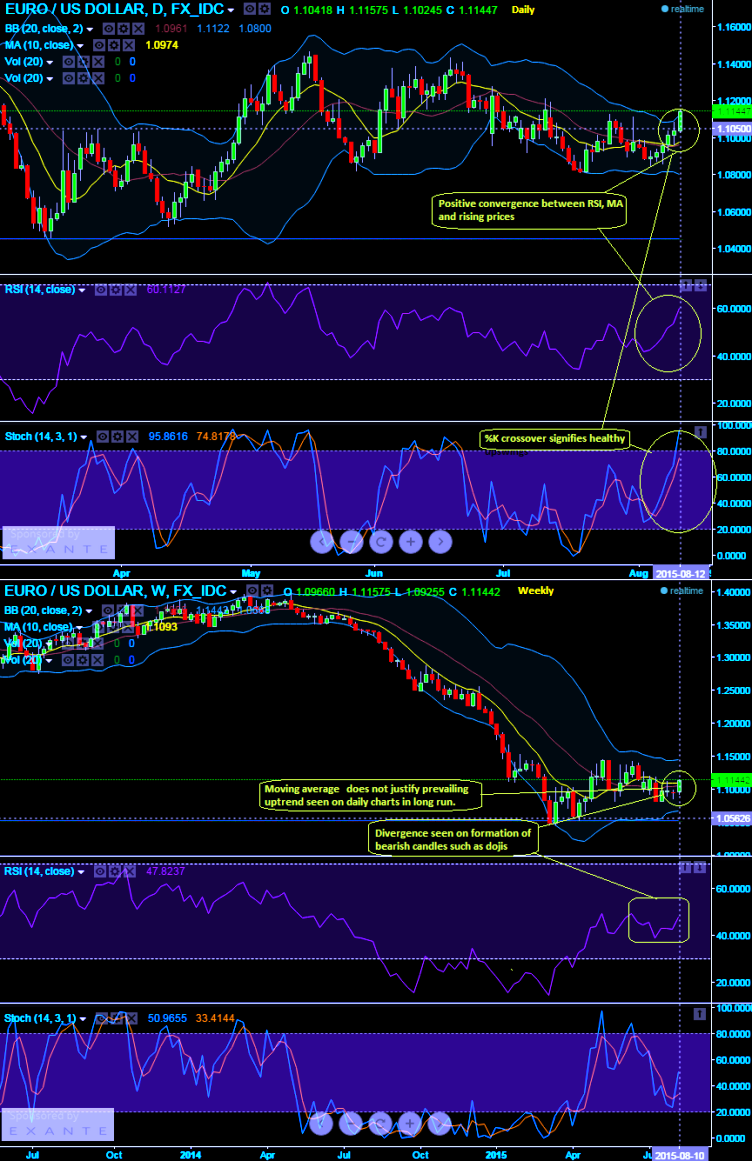
Trend observation:
- RSI: Upswings are supported by this oscillating strength index on daily charts as we saw positive convergence with rise in price. But long term trend is certainly puzzled when plotted weekly graphs.
- Stochastic: Prevailing uptrend to persist as it %K crossover signifies rising prices are not yet overweighed. Same is the case with long term trend by stochastic.
- 20 day Moving averages: This lagging indicator is suggesting prices for current trend is moving in quite right direction. Long term remains deceptive.
- RSI (14) on weekly chart converging with rising prices (Currently, RSI trending at 47.9514). This momentum indicator has started evaluating when the prices touched 1.0828 by taking the computation of last 14 weeks periods the magnitude of recent gains to recent losses in an attempt to signify buying interest.
- While %K crossover has shown finally on slow stochastic curve with every price rises (Currently, %K line at 51.5831 while %D line at 33.7714). Stochastic on monthly curve also remains in the oversold territory but an attempt of %K crossover signifies a very little strength in the euro.


