


 Silver Cracks Key 365-Day EMA for First Time Since Feb 2024; Bears Eye $50 on Rallies
  SpaceX Stock Gets $175 Target as Analysts See Massive Growth Ahead
  World Cup technology: from ref cams to AI analysts, cutting-edge research is changing the game
  Goldman Sachs: US Dollar Likely to Stay Strong Despite Oil Price Retreat
  How Donald Trump has changed the way diplomacy is done
  Gold Surges Above Key EMAs, Bulls Eye Resistance Amidst Bullish Momentum
  Today’s space race could turn fatal if we don’t agree on new rules
  J.P. Morgan Sees Potential Vestas Guidance Upgrade Amid Strong Wind Energy Demand
  How AI prompting turned writerly description into an everyday skill


 - EconoTimes)


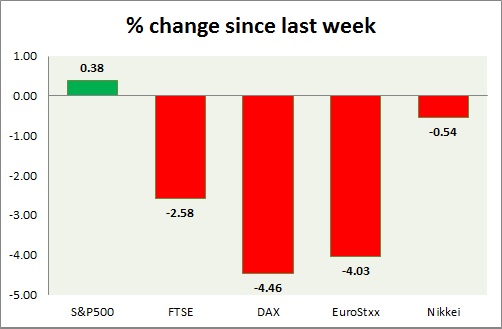
Equities are mixed to end the week. Performance this week at a glance in chart & table -
S&P 500 -
- S&P is showing uncertainty as traders are back and forth in green and red. Today's range 2089-2077.
- Producer price index rose by 0.3% in July, excluding Food and energy.
- Industrial production rose by 0.6% in July.
- Michigan consumer sentiment dropped to 92.9 from 93.1
- S&P 500 is currently trading at 2086. Immediate support lies at 1980, 2040 and resistance 2150.
FTSE -
- FTSE dropped further, wiping out this year's entire gains. Today's range 6600-6540.
- FTSE is currently trading at 6560. Immediate support lies at, 6050, 6450 and resistance at 6850, 7000.
DAX -
- DAX reversed initial gains and dropped further. Today's range 11100-10910.
- DAX is currently trading at 11000. Immediate support lies at, 10500 area and resistance at 11800 around.
EuroStxx50 -
- Stocks across Europe are red today as GDP growth turned out to be weaker than expected at 0.3% for second quarter.
- Germany is down (-0.27%), France's CAC40 is down (-0.45%), Italy's FTSE MIB is down (-0.51%), Portugal's PSI 20 is up (+0.12%), Spain's IBEX is down (-0.42%)
- EuroStxx50 is currently trading at 3495, down by -0.4% today. Support lies at 3300 and resistance at 3760.
Nikkei -
- Nikkei is relatively better performer as weaker yen and foreign inflows continued to provide cover.
- Nikkei is currently trading at 20520, with support around 20000 and resistance at 21000.
|
S&P500 |
+0.38% |
|
FTSE |
-2.58% |
|
DAX |
-4.46% |
|
EuroStxx50 |
-4.03% |
|
Nikkei |
-0.54% |


