


 Jamie Dimon Warns Anthropic's Mythos AI Poses National Security Risks
  Why financial hardship is more likely if you’re disabled or sick
  Columbia Student Mahmoud Khalil Fights Arrest as Deportation Case Moves to New Jersey
  Gold Surges on Geopolitical Tensions: Buy Dips Toward $4205/$4300
  6 simple questions to tell if a ‘finfluencer’ is more flash than cash
  The American mass exodus to Canada amid Trump 2.0 has yet to materialize
  Stuck in a creativity slump at work? Here are some surprising ways to get your spark back
  Disaster or digital spectacle? The dangers of using floods to create social media content
  Yes, government influences wages – but not just in the way you might think
  UBS Boosts China Tech Bets, Adds Kuaishou and Meituan to Focus List


Household electricity bills in Australia have increased sharply in the past decade. But new official figures show they are projected to fall markedly - in some cases by 20%.
In-house modelling we conducted at the Australian Energy Market Commission (AEMC) shows that a wave of new renewable energy entering the electricity grid is pushing down retail prices. The findings are contained in a report released today.
Retail electricity bills are projected to fall by 7.1% between 2019 and 2022, based on the national average. In southeast Queensland, household bills are expected to fall by 20% in that time - an average annual saving of A$278. Falls in other states are projected to be smaller.
A quick history
The National Electricity Market (NEM) is one of the largest interconnected electricity systems in the world. It comprises about 40,000km of transmission lines and cables, supplying around 9 million customers in all Australian jurisdictions except Western Australia and the Northern Territory.
To understand the significance of our projection for electricity prices, a brief history recap is helpful.
Price trends since 1955 can be divided into three distinct periods:
-
1955 to 1998, before the east coast’s National Electricity Market (NEM) was established. Prices fell due to economies-of-scale achieved by building large coal-fired power stations and transmission lines
-
1999 to 2009, the first ten years of the NEM, when prices declined due to the introduction of competition between generators, improved price transparency and pricing efficiency
-
2009 to 2019, when retail electricity prices doubled.
The increase between 2009 and 2019 was due to three factors: a significant and largely unnecessary rise in spending on network infrastructure (“poles and wires”); uncertainty about climate policy; and a large increase in wholesale prices.
The latter was triggered by both rising coal and gas prices and sudden exit of coal-fired power generators, and created a disorderly transition to firmed renewables.
What’s happening now
Electricity prices are determined by five main factors:
- wholesale costs: the cost of generating electricity from coal, gas, hydro, wind and solar
- transmission costs: the cost of transmitting electricity across the country
- distribution costs: building and maintaining the poles and wires in our streets
- environmental costs: government policies that drive new investment in renewable and low-emission generation
- retail costs: the cost of billing, customer service and managing the financial risks of operating in the wholesale market.
Our modelling shows that additional electricity supply is now putting significant downward pressure on wholesale prices. Across the country, prices are expected to fall by 7.1% from 2019 to 2022.
This is due to a very large quantity of new renewable projects coming online, adding much-needed supply. In fact, at the time of our wholesale market modelling earlier this year, investors had committed to around 7,500 megawatts of new gas, wind, solar and hydro projects. For perspective, the largest coal-fired generator in the market today is around 2,000MW.
So what’s driving this new investment? The sudden closure of coal-fired power stations such as Hazelwood in Victoria took a lot of electricity from the system, leading to higher wholesale prices. This drove new investment in gas, wind and solar generation, which is projected to cause prices to fall.
Our modelling shows wholesale costs falling by 10-17% by 2022 across the NEM, which should flow on to the retail price paid by households.
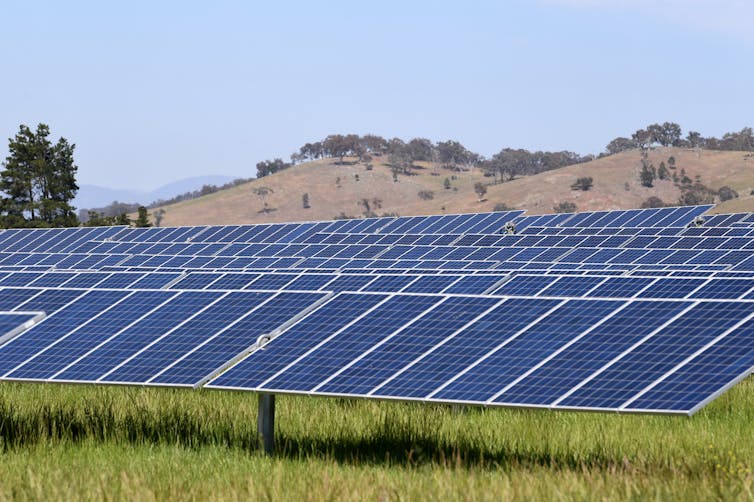
An influx of new renewable energy, including solar power, is driving wholesale prices down. Lucas Coch
How much you could save
The below table shows the projected fall in electricity bills expected in each state and territory in the NEM. They range from a 20% fall in Queensland to 2% in South Australia.
The figures vary between states because of the other factors which determine retail prices. For example, network prices are expected to fall in Queensland but increase in Victoria.
Environmental costs are also expected to fall across the NEM as subsidies such as the Renewable Energy Target wind down.
The wholesale market operates according to real time electricity supply and demand, meaning prices are likely to change across the day. Increased solar generation has long been expected to reduce prices in the middle of the day when solar farms are at maximum production. This is now happening.
In the past few months, this has even led to negative pricing – generators paying customers to stay in the system.
As shown in the chart below for Queensland, price reductions from 2019 to 2022 are most pronounced in the middle of the day, and most limited in the evening when electricity demand peaks but solar output is zero.
So what next?
A lot of work is required to ensure these projections are realised in the longer term. The Australian Energy Market Operator’s Integrated System Plan outlines the need for investment in new transmission infrastructure to ensure new supply can feed into the system. National energy authorities must also keep improving the design of the market beyond 2025.
Electricity prices are not the only factor affecting the size of your bill; how much electricity you use is obviously also important. Policymakers must continue to enable customers to minimise their energy bills through measures that encourage energy efficiency, as well as lowering peak electricity demand.
Customers should also continue to shop around to get the best deal by visiting government comparison sites such as the Australian Energy Regulator’s Energy Made Easy and in Victoria, Victorian Energy Compare).


