


 FxWirePro- Major Crypto levels and bias summary
  ETHUSD Bullish Momentum: Follows BTC Above All EMAs, Buy Dips Near $1750 Targeting $2300
  Bank of America Upgrades T-Mobile to Buy, Says LEO Satellite Fears Are Overdone
  Goldman Sachs Raises USD/JPY Forecast, Sees Yen Weakness Persist Through 2027
  Morgan Stanley Says China’s Reusable Rocket Progress Poses Long-Term Challenge to SpaceX


Becoming the first publicly listed Korean corporation to implement an institutional Bitcoin strategy, South Korea's KOSDAQ-listed Bitplanet has introduced an innovative Bitcoin treasury initiative. First buy of 93 BTC in August 2025. Emphasizing controlled infrastructure under Financial Services Commission monitoring, the company hopes to gather 10,000 BTC via a daily purchasing plan supported by a $40 million investment. Bitcoin ETFs, meanwhile, saw strong activity, registering $446.3 million in net inflows last week, led by BlackRock's IBIT ($324.3 million, 72.7% of flows); nevertheless, Grayscale's GBTC faced $117.1 million in outflows. Bitcoin ETFs' weekly trading volume hit $3.34 billion, much above Ethereum's $1.41 billion, with October's $4.21 billion in inflows pushing Bitcoin's price to $111,600, showing significant institutional demand.
With institutional players displaying a bullish attitude by means of major motions, whale activity magnified market forces even more, including a $182 million long position with a $53,000 liquidation. wallet 0xC50a priced a 40x leveraged long on 149 BTC worth $16.65 million. With $30 million in unrealized profits, another whale, 0xc2a, increased its holdings to $170.46 million in BTC and $167.35 million in ETH. Large exchange deposits, such as 200 BTC to Kraken amid a 5,603 BTC ($627.1 million) swing over two weeks, however, point to possible selling pressure and volatility around major support levels. Institutional bullishness continues as Bitcoin trades over $115,000, supported by ETF inflows and whale build-up, with leveraged longs accounting for 51.98% of the BTC market.
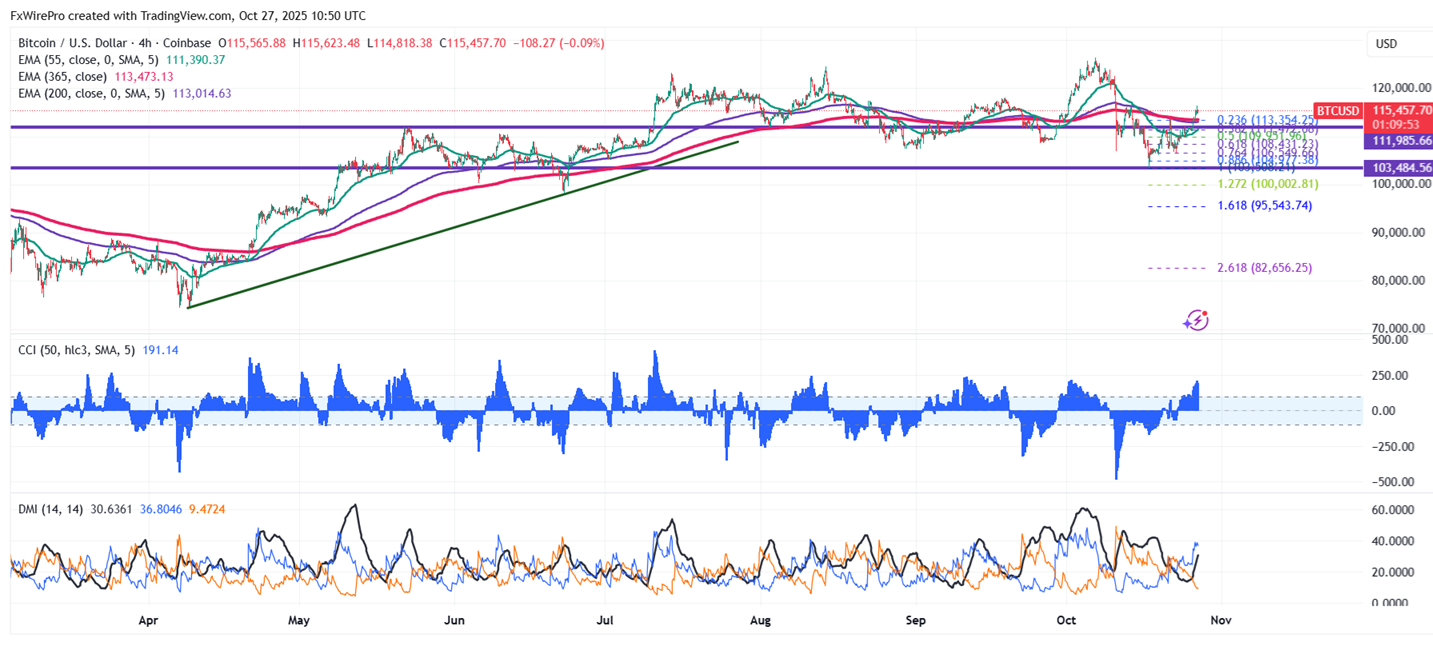
Technical Analysis: Key Levels to Watch for BTC/USD
BTC/USD gained above $115000 on strong institutional demand. The pair hits a high of $116410 and is currently trading around $115410.
It trades above short-term (34-EMA and 55-EMA) and long-term (200 and 365-EMA) moving averages on the 4-hour chart. Minor support is around $113000; breaking below this would drag the pair down to $108000/$103000/$10000/$98450/$94800. Immediate resistance is around $12000 indicates that closing above this level could lead to targets $126500/$130000.
Investment Strategy: Opportunities for Traders
Indicators (4-hour chart).
CCI(50)- Bullish
Directional movement index - Bullish
It is good to buy on dips around $113000 with a stop-loss set at $108000 for a TP of $120000/$126500.


