


 Jamie Dimon Warns Anthropic's Mythos AI Poses National Security Risks
  Wall Street Analysts Weigh in on Latest NFP Data
  US Gas Market Poised for Supercycle: Bernstein Analysts
  European Stocks Rally on Chinese Growth and Mining Merger Speculation
  U.S. Stocks vs. Bonds: Are Diverging Valuations Signaling a Shift?
  Moldova Criticizes Russia Amid Transdniestria Energy Crisis
  S&P 500 Relies on Tech for Growth in Q4 2024, Says Barclays
  Gold Pulls Back After Hitting $4,180 as Geopolitical Risk Sends Crude Higher
  US Futures Rise as Investors Eye Earnings, Inflation Data, and Wildfire Impacts
  Oil Prices Dip Slightly Amid Focus on Russian Sanctions and U.S. Inflation Data
  Mexico's Undervalued Equity Market Offers Long-Term Investment Potential
  Morgan Stanley Names Marks & Spencer Top European Retail Pick, Sees Strong Upside
  Gold Prices Fall Amid Rate Jitters; Copper Steady as China Stimulus Eyed
  Goldman Predicts 50% Odds of 10% U.S. Tariff on Copper by Q1 Close


Today, the bullion market prices inched higher towards $1,298, not considerably though. But bulls could not sustain the rallies despite renewed trade optimism. Despite today’s gain, the safe-haven metal still attempts to drag towards three-month lows.
Goldfields managed to produce 2.036 million ounces of gold during 2018, at all-in sustaining (AISC) costs of $981 per ounce. For 2019, the company expects to produce 2.13 million–2.18 million ounces of gold at AISC of $980-995 per ounce.
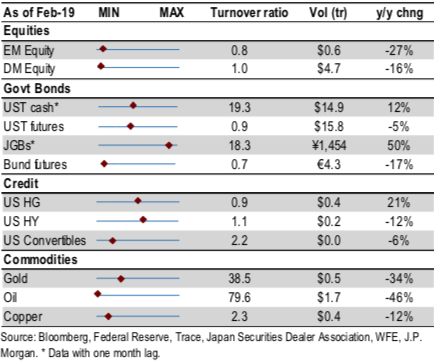
As per the trading turnover monitor, volumes are monthly and turnover ratio is annualized (monthly trading volume annualized divided by the amount outstanding).
UST Cash is primary dealer transactions in all US government securities.
UST futures are from Bloomberg. JGBs are OTC volumes in all Japanese government securities.
Bunds, Gold, Oil, and Copper are futures. Gold includes Gold ETFs. Min-Max chart is based on the Turnover ratio.
For Bunds and Commodities, futures trading volumes are used while the outstanding amount is proxied by open interest. The diamond reflects the latest turnover observation. The thin blue line marks the distance between the min and max for the complete time series since Jan-2005 onwards. Y/Y change is the change in YTD notional volumes over the same period last year.
While Gold futures & CFDs traded on the Comex division of the NYME are up about 0.2% to $1,296.50 at press time (12:40 GMT). Courtesy: JPM
Currency Strength Index: FxWirePro's hourly EUR is at -43 (bearish), hourly USD spot index is inching towards 83 levels (bullish), while articulating at 12:41 GMT.
For more details on the index, please refer below weblink: http://www.fxwirepro.com/currencyindex


