


- AUD/CAD pauses downside at 0.96 handle, bias still bearish.
- Dovish RBA continues to weigh on the Aussie. Thursday will bring Trade Balance data for Australia at 01:30 GMT.
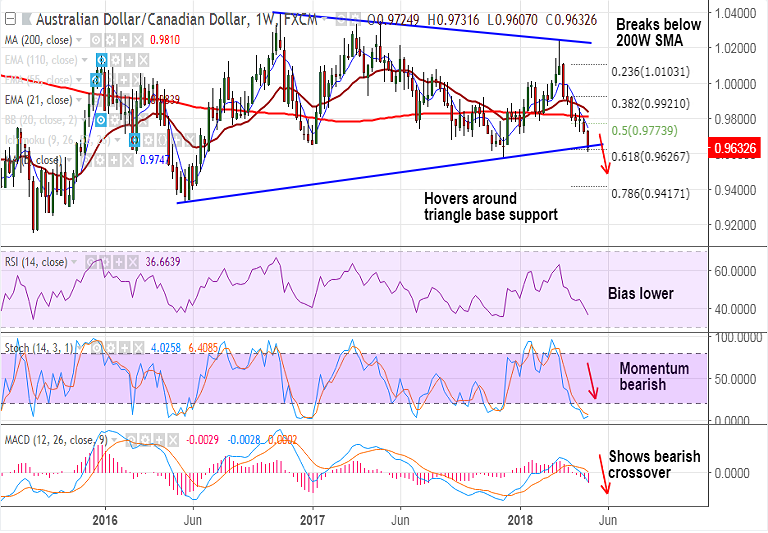
- The pair has broken below 200W SMA and is currently hovering around major trendline support at 0.9645.
- The pair is trading in a Symmetric Triangle pattern and break below Triangle base support at 0.9645 raises scope for further downside.
- Technical indicators on weekly charts are highly bearish. RSI weakness below 50 and biased lower.
- Stochs are sharply lower and MACD shows bearish crossover on signal line.
- Next major support below Triangle base lies at 0.9579 (Dec 2017 low) ahead of 0.9417 (78.6% Fib).
- Immediate resistance is seen at 5-DMA at 0.9673. Bearish invalidation only on retrace above 200W SMA at 0.9810.
Support levels - 0.9626 (61.8% Fib), 0.96, 0.9579 (Dec 2017 low), 0.9417 (78.6% Fib)
Resistance levels - 0.9673 (5-DMA), 0.97, 0.9746 (5W SMA), 0.98
Call update: Our previous call (https://www.econotimes.com/FxWirePro-AUD-CAD-extends-break-below-200W-SMA-eyes-trendline-at-09645-stay-short-1280888) has hit TP1/2.
Recommendation: Book partial profits at lows. Watch out for decisive break below Triangle base for further weakness.
FxWirePro launches Absolute Return Managed Program. For more details, visit http://www.fxwirepro.com/invest.


