


 JPY Action Bias: EURJPY and CADJPY Emerge as Extremely Bullish Pairs to Watch
  S&P 500 Relies on Tech for Growth in Q4 2024, Says Barclays
  Urban studies: Doing research when every city is different
  Moldova Criticizes Russia Amid Transdniestria Energy Crisis
  US Gas Market Poised for Supercycle: Bernstein Analysts
  Moody's Upgrades Argentina's Credit Rating Amid Economic Reforms
  Oil Prices Dip Slightly Amid Focus on Russian Sanctions and U.S. Inflation Data
  Nikkei Surges Past 65,000 on Suspected Yen Weakness: Tech Giants Like Advantest and NEC Lead Explosive Gains
  FxWirePro: GBP/NZD remains weak, eyes 38.2%fib support
  Trump’s "Shock and Awe" Agenda: Executive Orders from Day One
  Major European Indices Score Extremely Bullish: DAX Eyes 26000, CAC Targets 8600, FTSE100 at 11000 – Key Levels to Watch
  FxWirePro: GBP/USD rises as soft US data pressures dollar
  U.S. Treasury Yields Expected to Decline Amid Cooling Economic Pressures
  FxWirePro: NZD/USD consolidates overnight gains, but loses momentum
  Lithium Market Poised for Recovery Amid Supply Cuts and Rising Demand
  FxWirePro : GBP/NZD strongly bearish despite upside attempts
  Gold Prices Fall Amid Rate Jitters; Copper Steady as China Stimulus Eyed


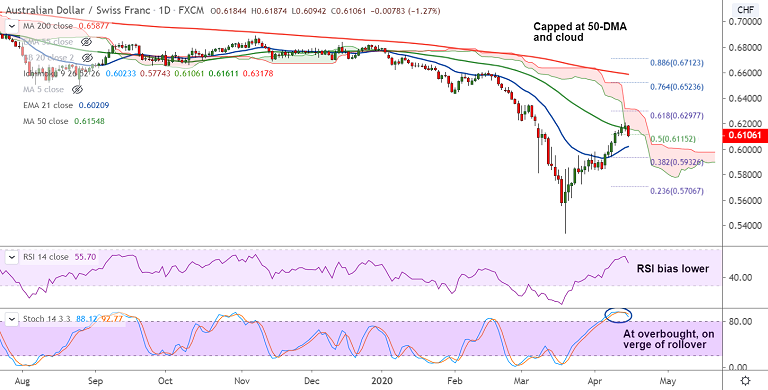
AUD/CHF chart - Trading View
AUD/CHF was trading 1.22% lower on the day at 0.6110 at around 11:25 GMT after 'Spinning Top' formation on the previous day's candle.
After gaining over 16% from 2020 lows at 0.5341, the pair is showing signs of minor correction.
Stiff resistance is seen at 50-DMA and daily cloud. Technical studies show oscillators are at overbought levels.
GMMA shows shift in major and minor trend on the hourly charts. Daily charts show neutral trend.
RSI has turned and Stochastics are on verge of rollover from overbought levels.
The pair finds strong support at 200H MA at 0.6050. Break below will confirm further weakness.
Next immediate support lies at 21-EMA at 0.6021 ahead of 38.2% Fib at 0.5932 and 20-DMA at 0.5929.
On the flipside, decisive break above 55-EMA required for upside continuation.


