


 How AI prompting turned writerly description into an everyday skill
  Today’s space race could turn fatal if we don’t agree on new rules
  Trump’s Iran Strategy: What Has Been Achieved After Three Months of Conflict?
  Gold's 365-Day EMA Streak Since Oct 2023 Faces Its First Real Test at $3,980 — Break or Bounce to $4,140?
  World Cup technology: from ref cams to AI analysts, cutting-edge research is changing the game
  How Donald Trump has changed the way diplomacy is done
  China’s AI Manufacturing Boom Masks Weak Consumer Economy, Citi Says
  J.P. Morgan Sees Potential Vestas Guidance Upgrade Amid Strong Wind Energy Demand
  Sell the Bounce": Gold Rally Stalls Near $4165 as Fed Hawks Slam the Door on Rate Cuts — Targets $4000/$3600
  SpaceX Stock Gets $175 Target as Analysts See Massive Growth Ahead


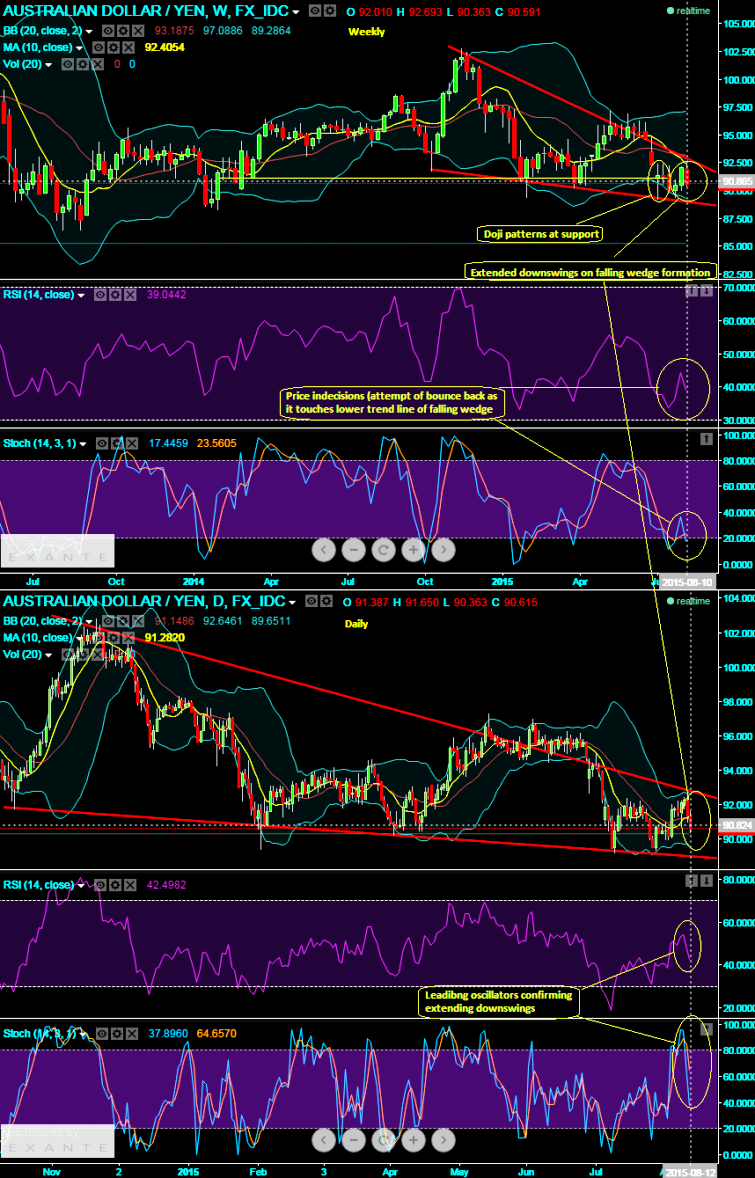
To precisely stating, it is going to be downtrend until it touches 89.347 levels which is at the lower trendline of falling wedge. More précising stating expect downswings in short term trend, bounce back likely in medium term but needs to be confirmed with other indicators.
Both EOD and weekly graphs suggest bearish signals on extended swings in falling wedge formation, Doji patterns formed when the pair was testing a crucial support at around 90.555 levels on weekly charts which means the indication of weakness at that level was intesified.
Leading oscillators like RSI and slow stochastic curves converging downwards according to the price dips on daily charts which is an indication of short term drops on the cards, since it has breached above supports we believe the breach of this level has set the downward direction of next short term trend.
RSI and stochastic on weekly signifies price indecision with daily price fluctuations, so we reckon the short term downtrend which is on falling wedge is temporary until it approaches lower trendline, then at that point of time on subsidiary technical confirmation trend reversal can be adjudged.


