


 FxWirePro: EUR/NZD firms after ECB holds rates steady at 2.25%
  NZDJPY Bullish Dip-Buy Setup: 93.60 Support Unlocks Path to 97
  FxWirePro- Major Crypto levels and bias summary
  FxWirePro- Woodies pivot (Major)
  FxWirePro- Major Crypto levels and bias summary
  FxWirePro: USD/CAD edges lower but bullish outlook persists
  AUDJPY Extends Four-Day Rally on Yen Weakness: Bullish Dip-Buy Eyes 117-118
  EUR/USD Slides After ECB Hold, Bearish Technicals Favor Rally Fades
  JPY Action Bias: USDJPY, EURJPY, and CADJPY Emerge as Top Extremely Bullish Picks
  Major Pairs Action Bias: USDCHF Emerges Extremely Bullish as EURUSD and GBPUSD Turn Deeply Bearish
  FxWirePro- Woodies pivot (Major)
  FxWirePro: USD/ZAR surges as rand slumps after SARB rate hold surprise
  FxWirePro: USD/CAD positions for another climb, eyes 1.4150 level
  Crypto Bias Report: Trend Signals and Top Bullish Picks
  FxWirePro: GBP/AUD under pressure as pound continues to weaken
  FxWirePro: USD/CNY edges higher but bulls lack punch


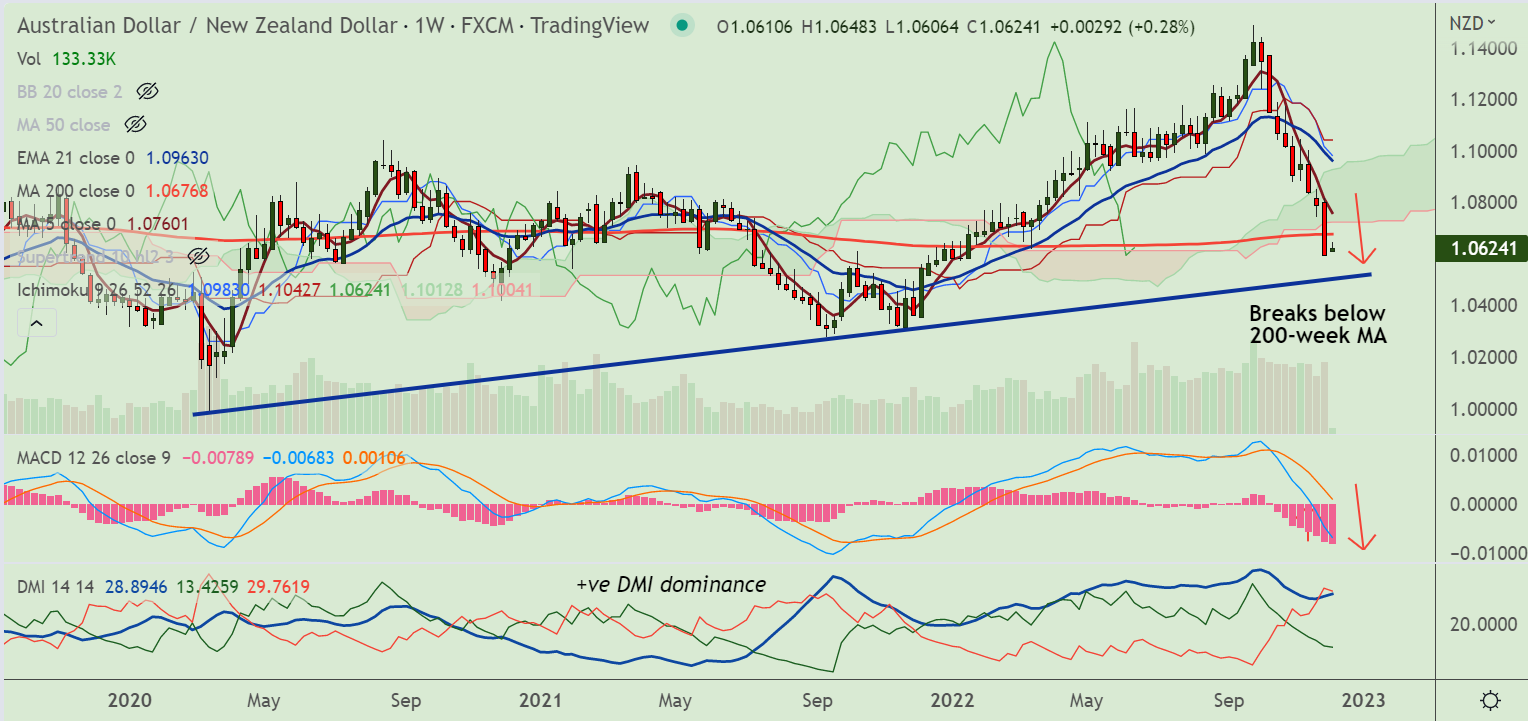
Chart - Courtesy Trading View
Technical Analysis:
- AUD/NZD was trading 0.31% higher on the day at 1.0627 at around 09:05 GMT
- The pair has broken below major support at 200-week MA raising scope for further downside
- Momentum is bearish, Stochs and RSI are well in oversold territory
- MACD and ADX support downside on the daily and weekly charts
- Price action has slipped below the weekly cloud
- GMMA indicator shows major and minor trend are bearish
Support levels:
S1: 1.0565 (76.4% Fib)
S2: 1.0515 (Rising trendline)
Resistance levels:
R1: 1.0676 (200-week MA)
R2: 1.0697 (5-DMA)
Summary: AUD/NZD trades with a bearish bias. Break below 200-week MA reinforces downside. Scope for test of trendline support at 1.0515.


