


 NZD/JPY Flatlines Near 94.60: Will Key Support Reignite the Uptrend?
  FxWirePro: USD/JPY eases ahead of Fed decision , Intervention risks linger
  FxWirePro: GBP/USD edges higher as traders await BoE guidance and UK fiscal clarity
  FxWirePro: GBP/AUD gains some upside momentum but still bearish
  FxWirePro: GBP/USD edges lower ahead of Fed policy verdict
  AUDJPY Weakness Deepens: Sell Rallies Toward 112 as Aussie Dollar Falters
  FxWirePro: EUR/ AUD gains some ground , but remains on bearish path
  Major Forex Pairs Action Bias: GBPUSD and AUDUSD Turn Extremely Bearish
  FxWirePro: USD/ZAR retreats but trend is still bullish
  FxWirePro: USD/CAD runs out of steam but maintains bullish outlook
  Buy the Dips on EUR/JPY: Bullish Structure Points to 188 Target Ahead of Fed
  EUR/JPY Holds Bullish Bias as Euro Extends Recovery
  FxWirePro: AUD/USD falls after softer-than-expected Australian Q2 CPI
  FxWirePro- Major Pair levels and bias summary
  FxWirePro: USD/ZAR firms ahead of Fed interest rate decision


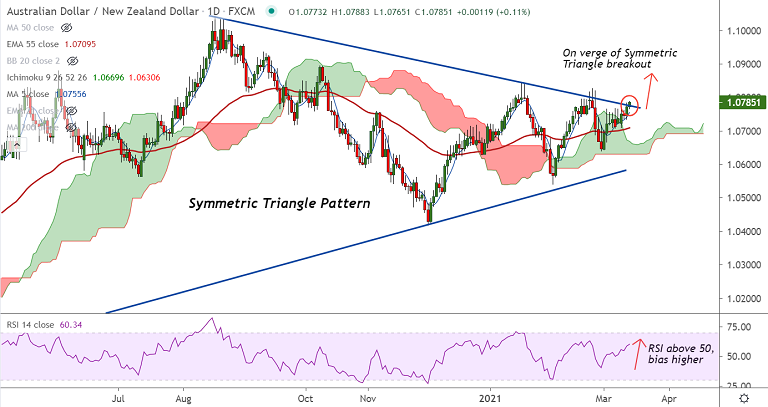
AUD/NZD chart - Trading View
AUD/NZD was trading 0.21% higher on the day at 1.0795 at around 10:00 GMT.
The pair has resumed upside momentum and is on track for further gains.
Price action has broken out of daily cloud and is on verge of Symmetric Triangle breakout.
Oscillators show momnetum is strongly bullish. Stochs and RSI are biased higher. RSI is above 50 and supports the uptrend.
Analysis of GMMA indicator shows major and minor trend are strongly bullish on the intraday charts.
Volatility is also rising as evidenced by widenining Bollinger bands. MACD shows a bullish crossover on signal line.
The pair is on track to test 1.0820 (trendline). Break above finds little resistance till 110-month EMA at 1.0963.


