


 FxWirePro- Woodies pivot (Major)
  FxWirePro: USD/ZAR firms ahead of Fed interest rate decision
  FxWirePro- Major Pair levels and bias summary
  FxWirePro: USD/JPY eases ahead of Fed decision , Intervention risks linger
  FxWirePro: AUD/USD falls after softer-than-expected Australian Q2 CPI
  FxWirePro: GBP/AUD gains above 1.9200 level , upside pressure builds
  Buy the Dips on EUR/JPY: Bullish Structure Points to 188 Target Ahead of Fed
  FxWirePro- Major Pair levels and bias summary
  FxWirePro: GBP/USD edges higher as traders await BoE guidance and UK fiscal clarity
  FxWirePro: USD/ CNY remains soft ahead of Fed decision
  FxWirePro: EUR/AUD regains upwards momentum but unable to hold above 50%fib level
  NZD/JPY Flatlines Near 94.60: Will Key Support Reignite the Uptrend?
  FxWirePro: GBP/AUD gains some upside momentum but still bearish
  FxWirePro- Major Crypto levels and bias summary
  Major Forex Pairs Action Bias: GBPUSD and AUDUSD Turn Extremely Bearish


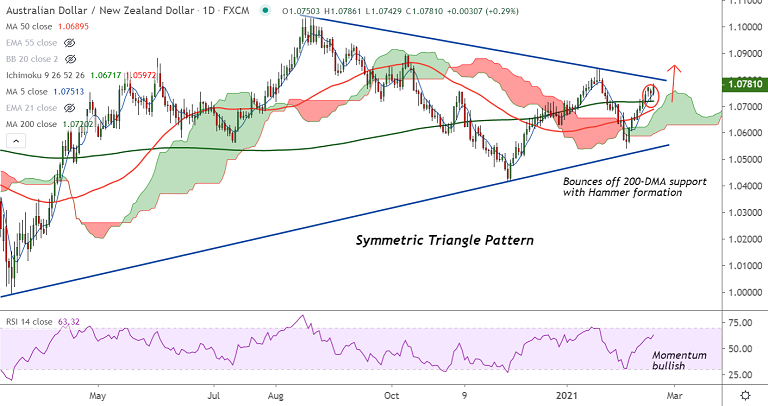
AUD/NZD chart - Trading View
Technical Analysis: Bias Bullish
- AUD/NZD trades 0.27% higher on the day at 1.0779 at around 10:00 GMT
- Pullback has bounced off support at 200-DMA (1.0719), weakness only on break below
- Hammer formation on Tuesday's candle suggests buying pressure at lows
- RSI and Stochs are bias higher, RSI is above 60 mark which shows strength in the uptrend
- Price action has edged above 55 month EMA at 1.0738, close above will open upside
- Analysis of GMMA indicator shows major trend is neutral and minor trend is bullish
- Scope for test of 1.08 mark. Breakout above Symmetric Triangle pattern will fuel further gains
Support levels - 1.0751 (5-DMA), 1.0738 (55 month EMA), 1.0720 (200-DMA), 1.0705 (21-EMA), 1.0686 (110-EMA)
Resistance levels - 1.08 (Trendline), 1.0843 (2021 high), 1.0895 (Oct 8th 2020 high), 1.0968 (110 month EMA)
Summary: Major trend in the pair is neutral, decisive break above stiff resistance is seen at 55 month EMA at 1.0738 will change near-term dynamics. Scope then for test of 1.08/ 1.0840/ 1.09.


