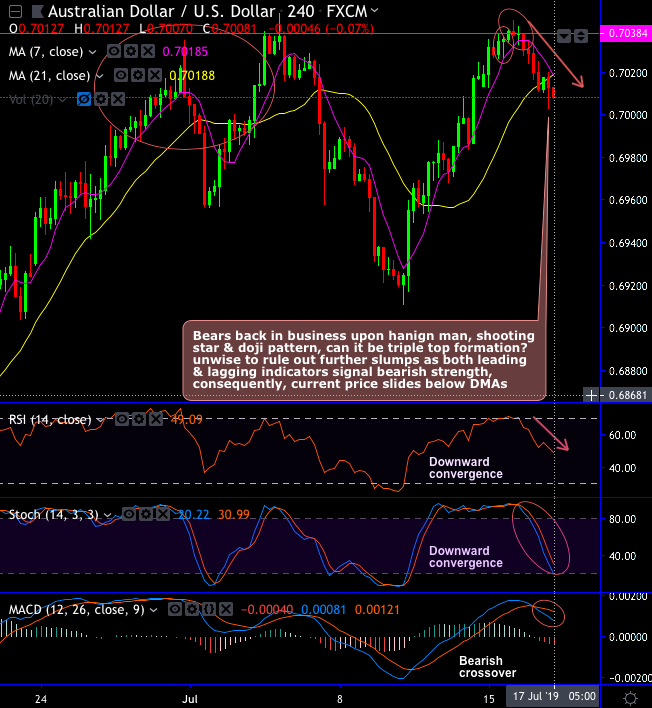
AUDUSD short term outlook: Hanging man, shooting star and doji patterns have occurred at 0.7035, 0.7037 and 0.7038 levels respectively.
Weakness in the minor trend is observed. Bears are back in the business upon the occurrences of above-stated bearish patterns at the peaks of rallies, consequently, the current prices slide below DMAs (refer daily chart).
So, it is unwise to rule out further price slumps as both the leading and lagging indicators signal bearish strength, So, can it be triple top formation?
We’ve seen the above bearish patterns with top 1 at 0.7034, top 2 at 0.7047 and top 3 at 0.7044 levels signals faded strength in the minor uptrend. Accordingly, at spot reference: 0.7011 level, tunnel spread options strategy is advocated using upper strikes at 0.7018 (i.e. 21-DMAs) and lower strikes at 0.70.
For now, any abrupt rallies likely to be exhausted upon potential bearish crossover at this juncture.
The pair is all set to trade between consolidation range of 0.6831-0.7025 areas, but it’s questionable how far it can run given trade tensions plus an RBA cut looming.
Long-term outlook: Bearish engulfing patterns at 0.7760 and 0.7042 levels nudge prices way below EMAs, consequently, the major downtrend dragged further 4-months lows upon breach below the double top neckline at 0.7359 level (refer monthly plotting).
While RSI and stochastic curves indicate the intensified selling momentum on this timeframe. To substantiate this weakness, bearish EMA and MACD crossovers signal downtrend to prolong further.
Hence, it is wise to snap any deceptive rallies at that juncture to build short hedges by shorting futures of mid-month tenors, as the AUD in the broader perspective still appears to be vulnerable.
On the flip side, as both the momentum and trend oscillators on daily term indicate strength for further price slumps.


