


 FxWirePro: USD/ CNY hits one-month low,scope for futher downside
  FxWirePro- Woodies pivot (Major)
  FxWirePro: USD/ZAR firms ahead of Fed interest rate decision
  Buy the Dips on EUR/JPY: Bullish Structure Points to 188 Target Ahead of Fed
  FxWirePro: NZD/USD firms as Kiwi gains on strong ANZ business outlook data
  Major Forex Pairs Action Bias: GBPUSD and AUDUSD Turn Extremely Bearish
  NZD/JPY Flatlines Near 94.60: Will Key Support Reignite the Uptrend?
  NZDJPY Bullish Rebound: Buy Dips as EMAs Align for 97 Target
  JPY Pairs Action Bias: EURJPY Leads as Bullish Standout Amid Mixed Momentum
  FxWirePro:EUR/NZD gains some upside momentum but still bearish
  FxWirePro: GBP/AUD gains above 1.9200 level , upside pressure builds
  FxWirePro : GBP/NZD strongly bearish despite upside attempts
  JPY Action Bias: EURJPY and CADJPY Emerge as Extremely Bullish Pairs to Watch
  FxWirePro: USD/JPY edges higher as focus shifts to BOJ decision
  FxWirePro: GBP/USD rises as soft US data pressures dollar
  FxWirePro: EUR/AUD regains upwards momentum but unable to hold above 50%fib level
  Major FX Action Bias & US Market Sentiment: NZD/USD (Extremely Bullish) & AUD/USD (Bullish) Watchlist


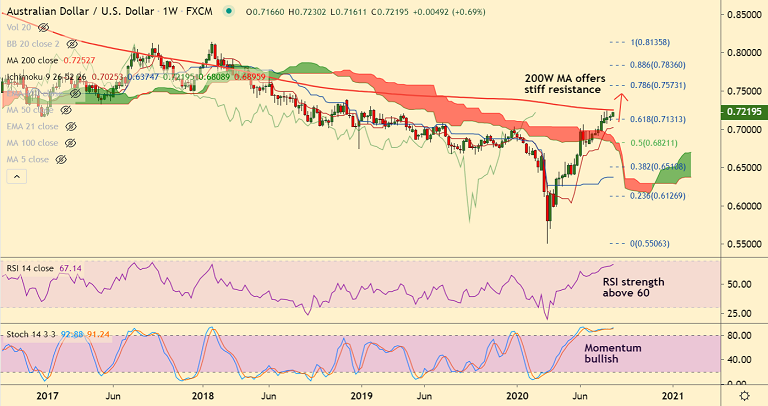
AUD/USD chart - Trading View
AUD/USD was trading in a narrow range, consolidating previous session's rise.
Price action has slipped lower from session highs at 0.7230 and was hovering around 0.7222 at around 04:00 GMT.
Aussie fades upside momentum after the RBA minutes from the August month’s monetary policy meeting confirm policymakers’ dovish bias.
That said, a better-than-forecast weekly consumer sentiment for Australia cushions downside in the pair.
Data released earlier today showed Australia’s ANZ-Roy Morgan Consumer Sentiment Index printed at 88.6, above the prior month's 86.5.
Technical indicators support upside. Risk sentiment and political news will influence price action amid a data light calendar.
21-EMA is strong support at 0.7139. Break below will change near-term dynamics. On the upside, watch out for decisive break above 200W MA for further gains.
Major Support Levels:
S1: 0.72 (Psychological mark)
S2: 0.7182 (5-DMA)
S3: 0.7139 (21-EMA)
Major Resistance Levels:
R1: 0.7252 (200W MA)
R2: 0.0.7393 (Dec 2018 high)
R3: 0.7573 (78.6% Fib)
Summary: The pair trades with a bullish momentum. 200W MA is major resistance at 0.7252. Watch out for a decisive break above for upside continuation. Break below 21-EMA could see a change in near-term dynamics.


