


 With Iran and the US signing a peace deal, where does that leave Benjamin Netanyahu?
  Gold's 365-Day EMA Streak Since Oct 2023 Faces Its First Real Test at $3,980 — Break or Bounce to $4,140?
  AI Memory Boom Sparks Global Chip Supply Crunch
  How AI prompting turned writerly description into an everyday skill
  Today’s space race could turn fatal if we don’t agree on new rules
  Bank Regulation Rollbacks in the U.S. and UK Could Increase Financial Risks, Study Warns
  SpaceX Stock Gets $175 Target as Analysts See Massive Growth Ahead
  J.P. Morgan Sees Potential Vestas Guidance Upgrade Amid Strong Wind Energy Demand
  Goldman Sachs: US Dollar Likely to Stay Strong Despite Oil Price Retreat
  World Cup technology: from ref cams to AI analysts, cutting-edge research is changing the game
  Sell the Bounce": Gold Rally Stalls Near $4165 as Fed Hawks Slam the Door on Rate Cuts — Targets $4000/$3600
  Gold Surges Above Key EMAs, Bulls Eye Resistance Amidst Bullish Momentum


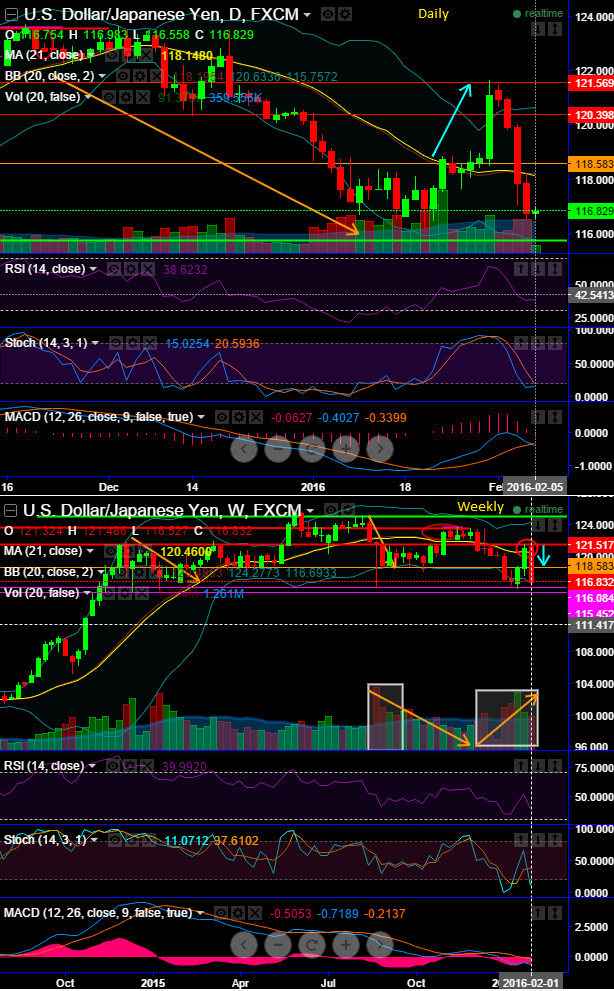
After the steep slumps, if you are expecting reversal upswings then you are likely to get bull trapped.
Refer our previous article:
http://www.econotimes.com/FxWirePro-USD-JPY-rejects-at-resistance-121486-%E2%80%93-more-dips-underway-152914
It is now urged for some more dips in USDJPY upon the formation of "Bearish engulfing" pattern candle at resistance around 121.517 levels on weekly chart, in between it has also broken an intermediary support at 118.583. We now reckon that these bearish patterns have more downside potential and would reveal a medium term downtrend direction.
It is also important to emphasize that the current prices slipping below 21 moving average on all time frames would be a serious warning of potential downtrend to prolong, not a signal, in and of itself, to go short. Overall pattern on the pair fixes it bearish view for a target of 116.084 and upon breach it may even head towards 115.452 levels in near terms.
While on daily charts, both leading and lagging indicators still have bearish signals as the price curve resembles as if they are heading towards deep tunnel, the back to back bearish candles with big real body reveals the weakness and seems like the pair is comfortable in the range between 115-118.
RSI (14) is beautifully converging downwards to these price dips at 38.4061, while slow stochastic has approached oversold trajectory but still %D crossover is stating selling pressures. Another boosting signal from MACD to remain bearish on charts with all timeframes.
Since USD/JPY's uptrend is rejected many important resistances, while other oscillating indicators shown a clear divergence to the previous upswings in sideway trend as well; for now, bearish sensation is piling up although interim upswings cannot be disregarded.
However, contemplating the overall downtrend,
BB (100, 2), if bands tight together up to 50 pips no trades, as my entry comes after the price has broken the red green lines with rsi turning the correct position also.
RSI (14) below (30's) still converging for bearish swings should approve the reversals.
Stochastic: %D crossover below overbought region indicates use any abrupt upswings as better shorting opportunities rather than building fresh longs.

- News

- Economy

- Central Banks
- Investing
- Research
- Roundups
- Digital Currency
- Insights
- Technical Analysis
- Technology
- Business
- Law
- Health
- Nature
- Fintech
- Science
- Topic
- Opinions
- ©Econometrics LLC . All Rights Reserved.
FxWirePro: After 118.583, USD/JPY is now on the verge of breaking 116.084 – resembling bearish engulfing pattern has more downside potential
Friday, February 5, 2016 6:34 AM UTC
Editor's Picks


- Market Data
Most Popular


