Technicals / Digital Currency

Add as a preferred source on Google

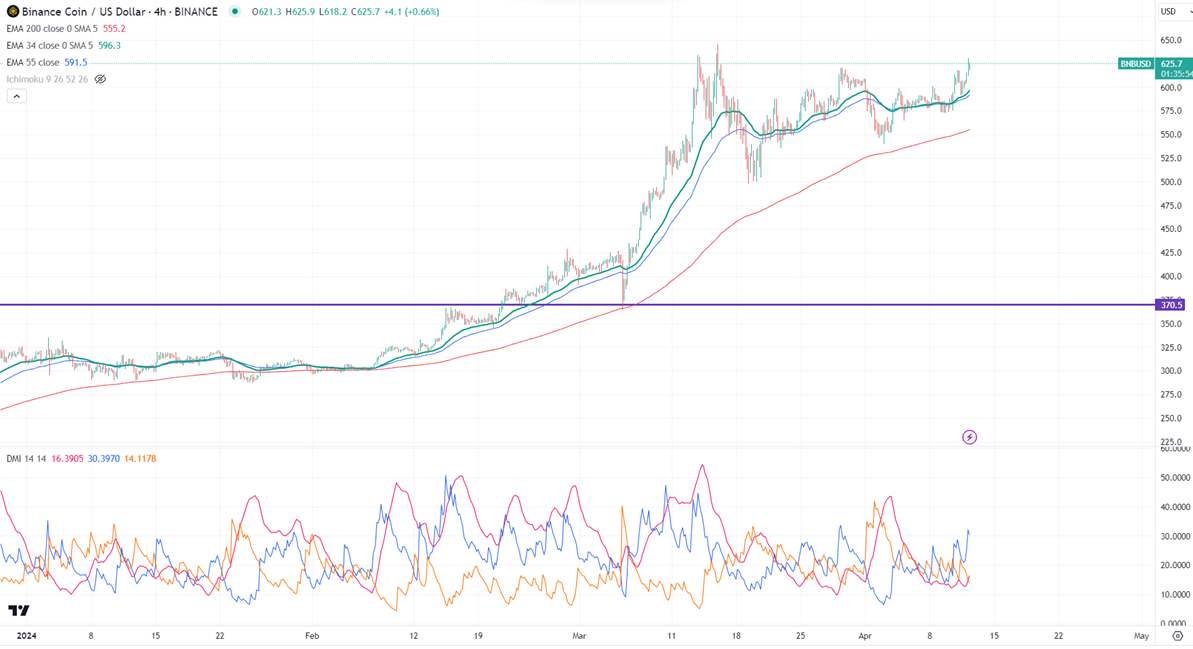
FxWirePro- BNBUSD (Chart of the day)

BNBUSD performed well in the past three days. Any daily close above $650 confirms further bullishness. BNBUSD gained nearly 10% in the past three days. The pair holds well above the short-term (21 and 55 EMA) and long-te…

1 min read
FxWirePro- BNBUSD (Chart of the day)
Image from the original EconoTimes article

Read the original article

BNBUSD performed well in the past three days.


Any daily close above $650 confirms further bullishness.


BNBUSD gained nearly 10% in the past three days.  The pair holds well above the short-term (21 and 55 EMA) and long-term moving average. It hit a high of $630 and is currently trading around $625.40.


The bullish invalidation can happen if the pair closes below $500. On the lower side, the near-term support is $590. Any break below targets $550/$500. 


The immediate resistance stands at around $650. Any breach above confirms bullish continuation. A jump to $700 is possible. A surge past $700 will take it to $800/$1000.


It is good to buy on dips around $550 with SL around $490 for TP of $750/$800.



Related articles

View all
Technicals

Major Pair Currency Score: AUDUSD Bearish

EURUSD - Levels to watch - 1.100 GBPUSD Levels to watch - 1.3180 USDCHF Levels to watch - 0.8400 USDCAD - Levels to watch - 1.4300 AUDUSD - Levels to watch - 0.7000 NZDUSD - Levels to watch - 0.5560

