


 Major Pair Action Bias: Extremely Bullish Surge Powers GBPUSD & NZDUSD as Bullish Momentum Ignites
  FxWirePro: NZD/USD trades in narrow range ,outlook bullish
  FxWirePro- Major Crypto levels and bias summary
  GBPJPY Bullish Surge: Strong Pound Ignites Fresh Upside on Fed-BOE Policy Divergence as All EMAs Align
  FxWirePro: GBP/NZD gains some upside momentum but still bearish
  FxWirePro- Major Crypto levels and bias summary
  FxWirePro: EUR/AUD neutral in the near term, scope for downward resumption
  EUR/USD Holds Bullish Tone Despite Pullback from Yesterday’s High
  FxWirePro- Major Crypto levels and bias summary
  Crypto Major Pair Action Bias: ETHUSD Bullish as BTCUSD, SOLUSD & XRPUSD Stay Neutral


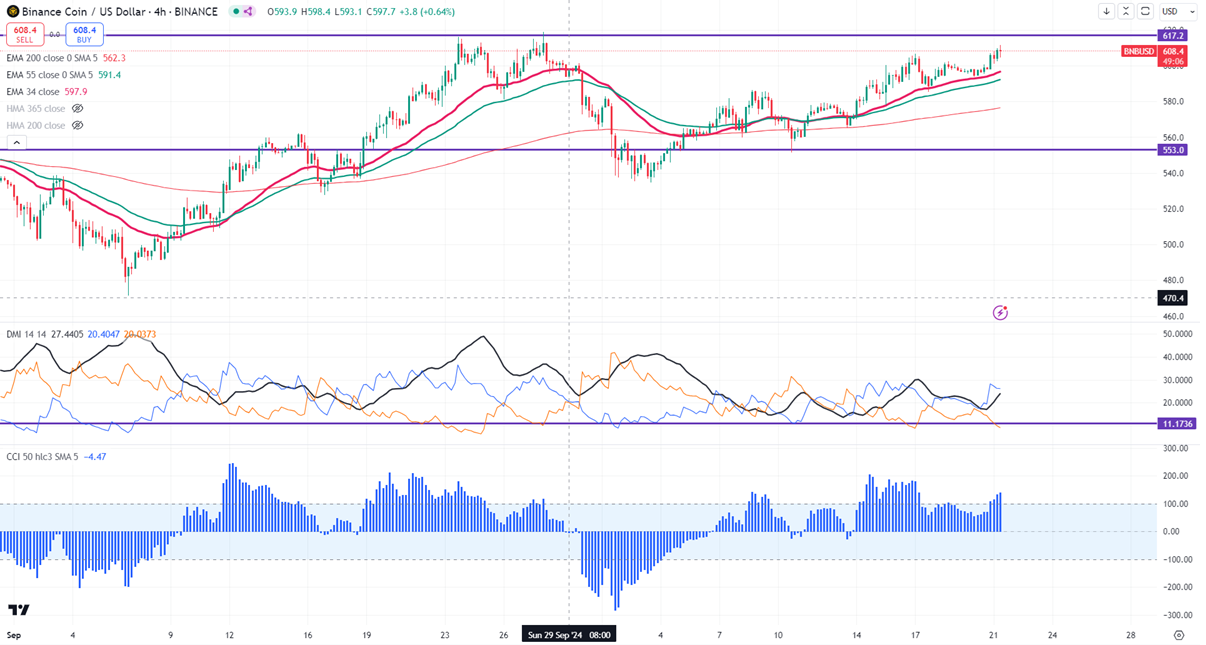
Intraday Outlook - Bullish
Key Level to Watch: $550
A close above $620 will indicate a continuation of the upward trend.
BNB/USD has been trading within a tight range of $611 to $600 for the last three days. It has been one of the strongest performers over the past two months, increasing by over 15%.
The momentum remains robust, with prices staying above the 34 and 55 EMA on the 4-hour chart. To maintain the bullish trend, it is essential to close above $620. Conversely, dropping below $551 could signal a bearish reversal. Immediate support is located at $585; a failure to hold this level could lead to further declines towards $560, $550, $540, $528, $500, and $470.
Current resistance is around $620; if this level is broken, it could indicate slight bullish strength. Should the price break above $620, there may be opportunities for further gains to $647 or even $700, with the potential to reach $800 if it surpasses $725.
Indicators (4-hour chart)
- Directional Movement Index: Bullish
- CCI (50): Bullish
It’s advised to consider buying on dips around $585, with a stop-loss set at $550 and a target price of $700.


