FxWirePro: BTC/GBP faces resistance at 161.8% fib, good to go long on breakout
BTC/GBP hit a fresh high of 633.33 levels on Friday and is currently trading slightly lower at 631 levels at the time of writing (Coinbase). Long-term trend: Bullish Short-term trend: Bullish Ichimoku analysis of daily c…
By Shampa Mani
Updated 1 min read
Image from the original EconoTimes article
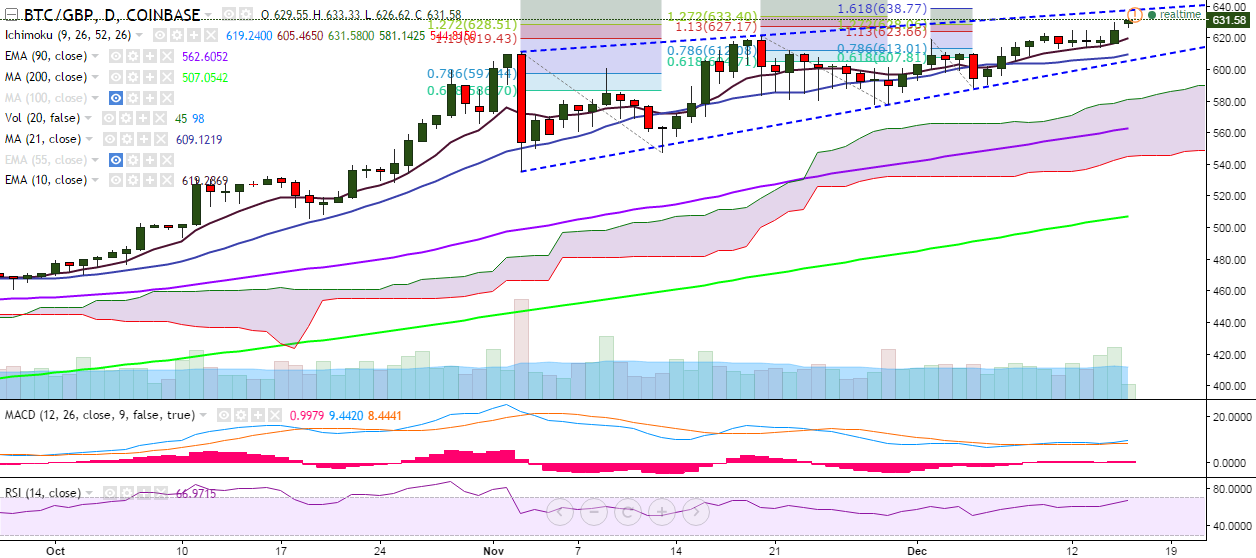
BTC/GBP hit a fresh high of 633.33 levels on Friday and is currently trading slightly lower at 631 levels at the time of writing (Coinbase).
Long-term trend: Bullish
Short-term trend: Bullish
Ichimoku analysis of daily chart:
Tenkan Sen: 613.12
Kijun Sen: 604
Trend reversal: 561 (90 EMA)
The pair faces strong resistance at 638.77(161.8% retracement of 619.64 and 588.68) which also shows the resistance from the trend line joining 611.12 and 621.47 (around 637 levels). Any violation of this level would see it testing 650 (161.8% retracement of 611.12 and 547.20)/700.
On the reverse side, 616.55 (10-EMA) is acting as a major support for the pair and a break below would drag it to 607.74 (21-DMA)/588.68 (December 05 low).
A one-hour tally put long liquidations at $230,000 across Binance, Bybit and OKX, versus $10,000 for shorts; Binance’s earlier four-hour snapshot showed a 3.50% decline.