


 FxWirePro- Major Crypto levels and bias summary
  Ethereum Cracks Under $1,700: Sell the Rally Near $1,750 as Bears Eye $1,380–$1,200
  FxWirePro- Major Crypto levels and bias summary
  FxWirePro- Major Crypto levels and bias summary
  FxWirePro- Major Crypto levels and bias summary
  BTC’s Bear Bounce: Sell the Rally Near $66K as Bears Target $59K–$52K Breakdown


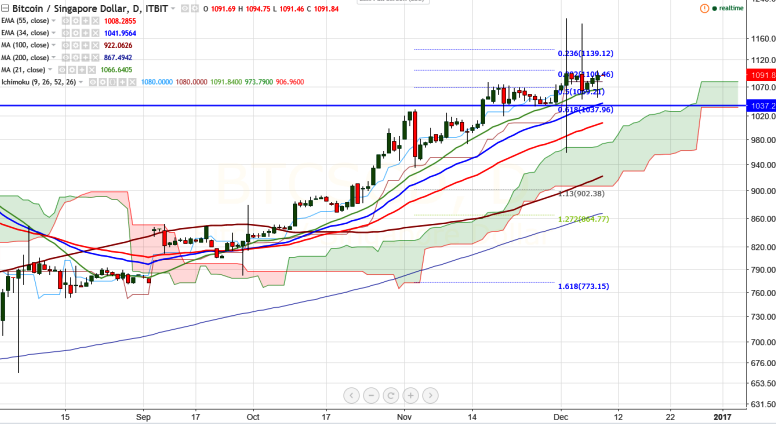
BTC/SGD is seen trading slightly above on Friday. The pair has recovered sharply after showing a dip till 1052 and is trading well above 21- day MA (ITBIT). It is currently trading around 1094.72 at the time of writing.
Ichimoku analysis of daily chart shows:
Tenkan-Sen level: 1080
Kijun-Sen level: 1080
Trend reversal level - (100 days MA) – 918.82
Long-term trend remains to be bullish. BTC/SGD is facing strong support at 21- day MA and slight weakness can be seen only if it closes below 21- day MA level.
Major resistance is around 1102 (38.2% retracement of 1189 and 1048) any break above that level will take the pair to next level till 1160 (127.2% retracement of 1051.92 and 650)/1204 (138.2% retracement of 1051.92 and 650). Short-term support is seen at 1065 (21- day MA) and any break below targets 1048(Dec 5th low)/ 1037 (61.8% retracement of 936 and 1200)/999 (55- day EMA).

- News

- Economy

- Central Banks
- Investing
- Research
- Roundups
- Digital Currency
- Insights
- Technical Analysis
- Technology
- Business
- Law
- Health
- Nature
- Fintech
- Science
- Topic
- Opinions
- ©Econometrics LLC . All Rights Reserved.
FxWirePro: BTC/SGD faces strong support at 21-day MA, good to buy on dips
Friday, December 9, 2016 5:21 AM UTC
Editor's Picks


- Market Data
Most Popular


