


 FxWirePro- Major Crypto levels and bias summary
  Ethereum Cracks Below $2,000 as Bitcoin Contagion Bites—Bearish EMA Stack Sets Sights on $1,700
  Bitcoin Bleeds $704M in ETF Outflows as Institutional Exodus Accelerates
  Ether Breaks Below $2,100: Triple EMA “Sell-the-Rally” Setup Targets $1,900
  Bitcoin Cracks $75K as $1.3B ETF Exodus and Middle East Jitters Spook Bulls; Bears Eye $70K
  FxWirePro- Major Crypto levels and bias summary
  FxWirePro- Major Crypto levels and bias summary
  Bitcoin Buckles at $73,500: Middle East Tensions and Weak Institutional Demand Set Bearish EMA Stack on $70K Collision Course
  FxWirePro- Major Crypto levels and bias summary


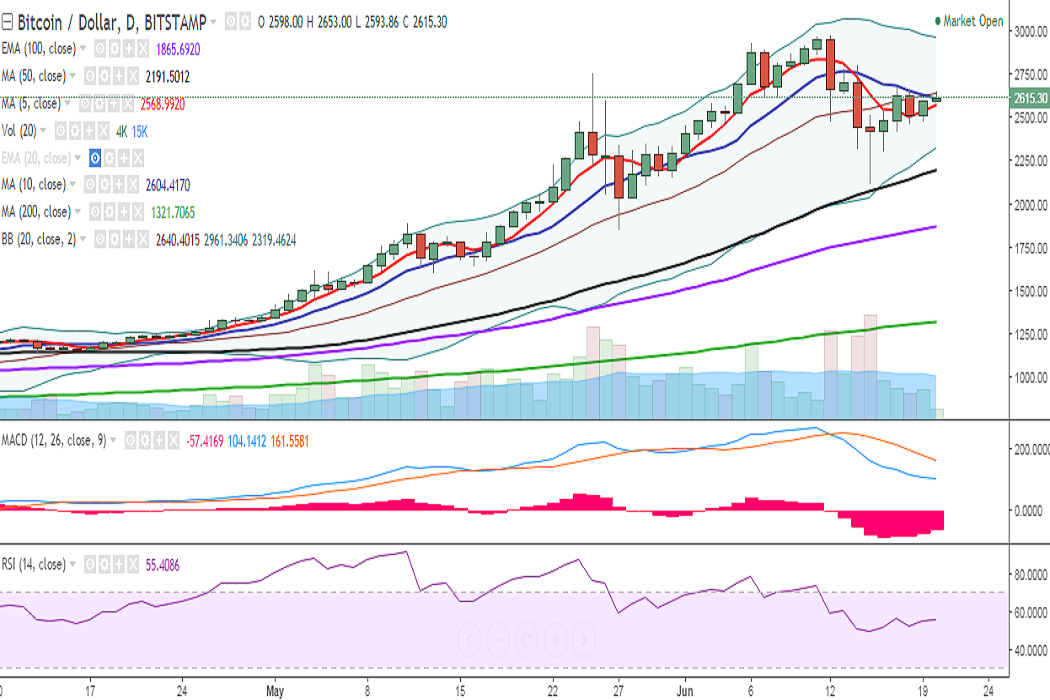
BTC/USD is trading in a narrow range just shy of 20-DMA. It is currently trading at 2615 levels at the time of writing (Bitstamp).
Ichimoku analysis of daily chart:
Tenkan Sen: 2550
Kijun Sen: 2415
On the upside, a consistent break above 2640 (20-DMA) would see further upside in the pair, targeting 2760 (May 25 high)/ 2878 (113% retracement of 2760 and 1850). Further strength would take it to 2933 (June 06 high)/ 2980 (June 12 high).
Support is seen at 2567 (5-DMA) and a break below would see a dip till 2449 (4h 200-SMA)/2391 (50% retracement of 1850 and 2933). Further weakness would drag it to 2281 (61.8% retracement of 1850 and 2980)/2191 (50-DMA).
Momentum studies: On the daily chart, RSI continues to hold above 50 and stochs are biased higher. MACD line is below the signal line, while downward momentum appears to be waning.
On the 4-hour chart, the pair has broken above major resistance at 50-SMA and trying to hold above that level. MACD, RSI, and stochs suggest bullish bias.
On the 2-hour chart, the pair is facing strong resistance at 2669 (200-SMA) and further upside would be seen only on a close above.
Recommendation: Traders are preferred to wait for a confirmed signal on the daily charts. Further bullishness would be seen only on a close above 20-DMA.

- News

- Economy

- Central Banks
- Investing
- Research
- Roundups
- Digital Currency
- Insights
- Technical Analysis
- Technology
- Business
- Law
- Health
- Nature
- Fintech
- Science
- Topic
- Opinions
- ©Econometrics LLC . All Rights Reserved.
FxWirePro: BTC/USD trades just shy of 20-DMA, further bullishness only on close above
Tuesday, June 20, 2017 8:56 AM UTC
Editor's Picks


- Market Data
Most Popular


