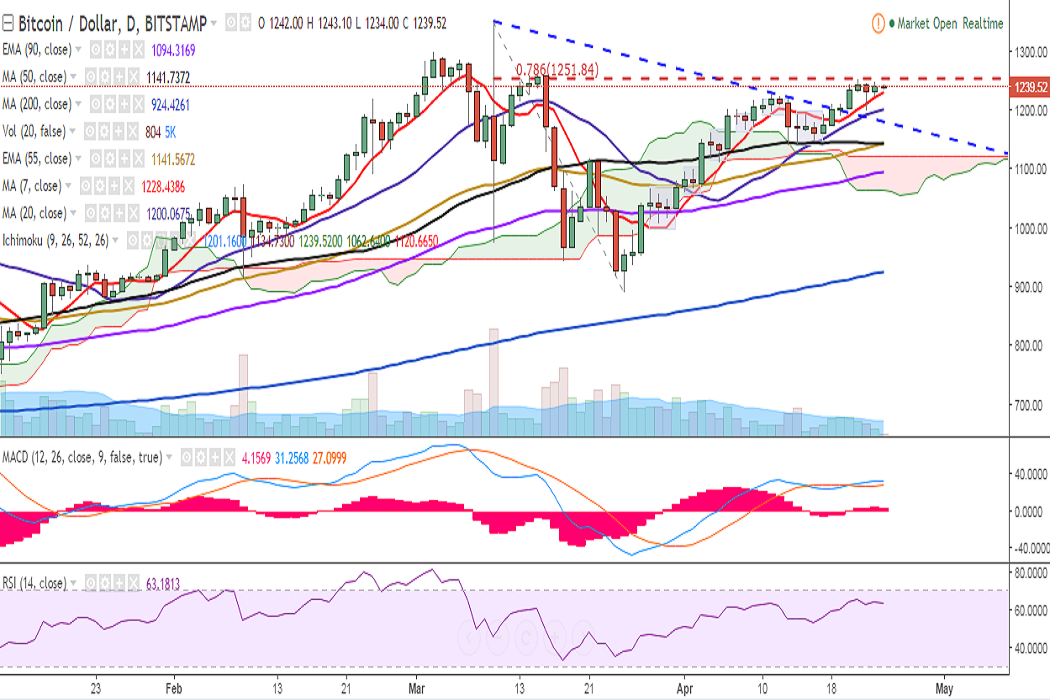
BTC/USD is trading in an extremely narrow range with its upside capped by 78.6% retracement of 1350 and 891.33. It is currently trading at 1239 levels at the time of writing (Bitstamp).
Ichimoku analysis of daily chart:
Tenkan Sen: 1201.16
Kijun Sen: 1134.73
On the upside, the pair faces strong resistance at 1251.84 (78.6% retracement of 1350 and 891.33) and a consistent break above would see it testing 1260 (March 15 high)/1298 (March 03 high).
Intraday bias appears neutral and further bullishness could be seen on a close above 12.51 levels. ‘On the daily charts, RSI is at 63, stochs are in overbought zones, MACD line is above the signal line.
On the downside, support is seen at 1228 (7-DMA) and any violation would see a dip till 1200 (20-DMA)/1172.99 (23.6% retracement of 891.33 and 1260).