


 Ukraine’s drone strikes are having an impact on Russia — but Russian leaders remain committed to war
  Is Netanyahu’s star waning in Washington? His latest meeting with Trump suggests it may be
  Tech Stock Positioning Nears Neutral as Investor Rotation Enters Final Phase, Deutsche Bank Says
  Gold Spikes to $4085 on Fed Pause as Traders Eye Sell-the-Rally Setup
  Gold Loses Momentum as Yields Rise and Safe-Haven Demand Fades
  Meta-backed research finds exposure to ‘untrustworthy’ social media is rare. The fine print is less reassuring
  3 clinical-grade skincare creams you really shouldn’t buy online


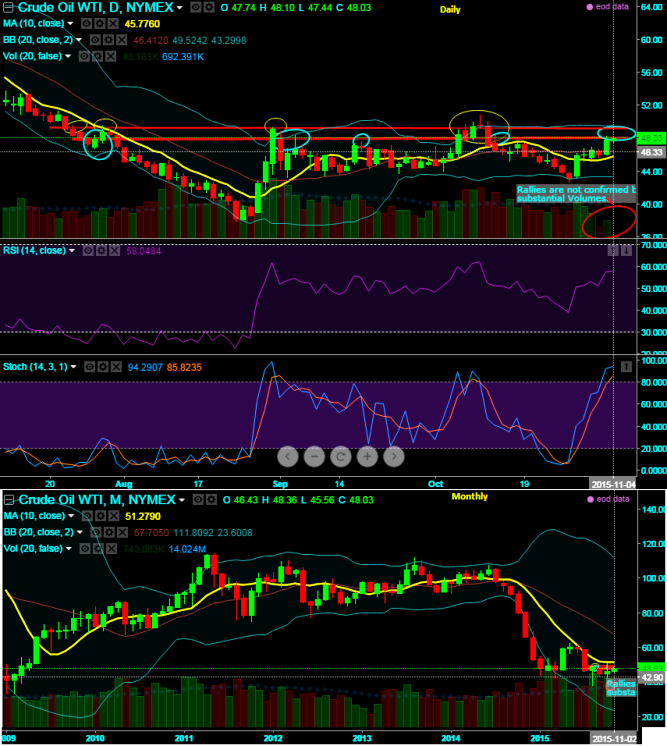
WTI crude is attempting to beach resistance at 48.10 levels which has already tested this level as crucial point of demand and supply several times in the past (see blue colored circled areas).
It may drag up to 49.40 if it manages to break above decisively. For now, we are bearish on this commodity and advisable to sell on every rally.
The selling indications are bolstering as there seems to be a factor called volumes fading away. Hence, we reckon the previous rallies were only due to short coverings and certainly not to be regarded as bullish trend unless it breaks above resistance levels.
RSI is showing bullish convergence to the prices rises (currently RSI 14 trending at 62.1708 while articulating).
While slow stochastic approached overbought territory but there are no convincing hints of %D crossover (currently %D line at 85.8235 & %K line at 92.2907)
We spotted out the series bearish candles like dojis both on daily and monthly charts and spot price is still fallen below moving average curve on monthly charts.
So overall we could foresee 46.50 as a strong support if it fails to hold onto 48.10. It is advisable to short futures at spot levels for immediate targets at 46.50 with stop loss at 48.50, thereby risk reward would be 1:2.

- News

- Economy

- Central Banks
- Investing
- Research
- Roundups
- Digital Currency
- Insights
- Technical Analysis
- Technology
- Business
- Law
- Health
- Nature
- Fintech
- Science
- Topic
- Opinions
- ©Econometrics LLC . All Rights Reserved.
FxWirePro: Crude struggling to break resistance at 48.10 - Short WTI crude for TP at 46.50 with risk rewards 1:2
Wednesday, November 4, 2015 12:59 PM UTC
Editor's Picks


- Market Data
Most Popular
1


