


 BTC’s Bear Bounce: Sell the Rally Near $66K as Bears Target $59K–$52K Breakdown
  FxWirePro- Major Crypto levels and bias summary
  FxWirePro- Major Crypto levels and bias summary
  FxWirePro- Major Crypto levels and bias summary
  Ethereum Cracks Under $1,700: Sell the Rally Near $1,750 as Bears Eye $1,380–$1,200


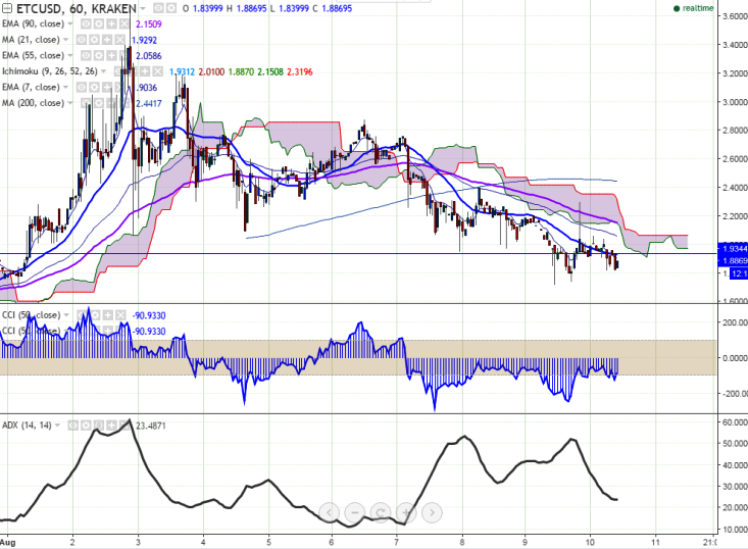
ETC/USD has retreated after making a high of $2.30 and declined till $1.82 at the time of writing. It is currently trading around $1.886 (Kraken).
Short term trend: bearish
Ichimoku analysis (Hourly chart):
Tenkan-Sen level: $1.9400
Kijun-Sen level: $2.010
Trend reversal level - (200 HMA)-$2.45
The pair is facing strong resistance at 200 HMA. ETC/USD should break above 200 HMA for further bullishness.
Any violation above $2.45 will take the pair to next level till $2.55 (61.8% retracement of $2.87 and $1.95)/$2.73/$2.880 (Aug high).The minor resistance is at $2.150/$2.300. On the lower side, minor support is around $1.65 (161.8% retracement of $1.95 and $2.399) and break below targets $1.41 (Jul 31 low).

- News

- Economy

- Central Banks
- Investing
- Research
- Roundups
- Digital Currency
- Insights
- Technical Analysis
- Technology
- Business
- Law
- Health
- Nature
- Fintech
- Science
- Topic
- Opinions
- ©Econometrics LLC . All Rights Reserved.
FxWirePro: ETC/USD struggles to close above $2, good to sell on rallies
Wednesday, August 10, 2016 11:35 AM UTC
Editor's Picks


- Market Data
Most Popular


