


 FxWirePro- Major Crypto levels and bias summary
  Ethereum Cracks Under $1,700: Sell the Rally Near $1,750 as Bears Eye $1,380–$1,200


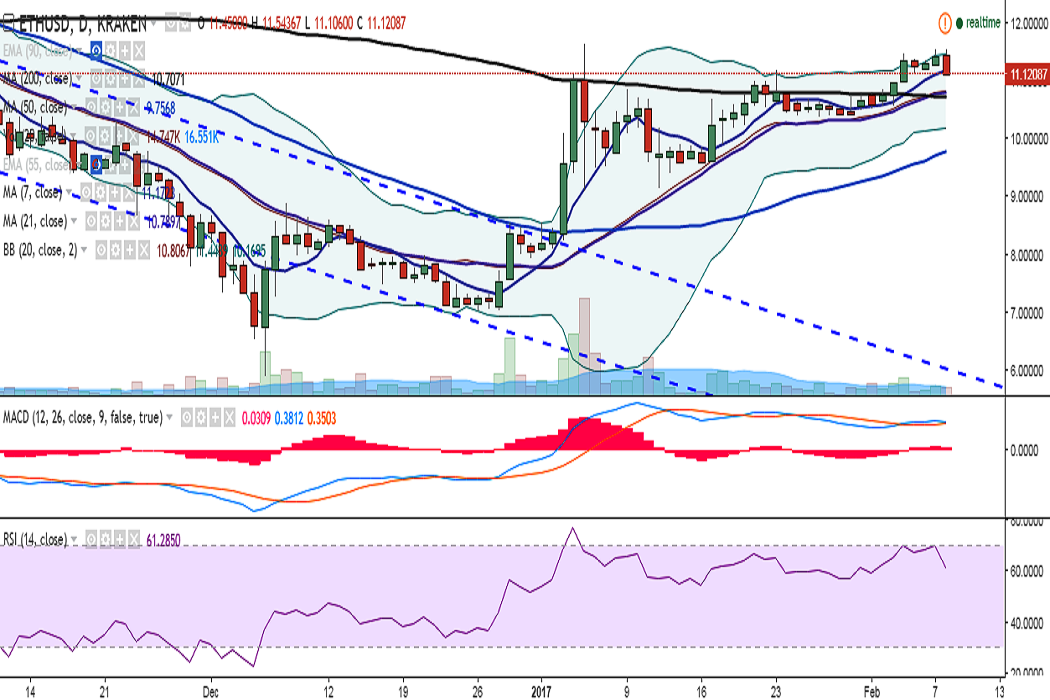
ETH/USD turned red on Wednesday as it failed to break above 11.55 levels. It is currently trading at 11.12 levels at the time of writing (Kraken).
Ichimoku analysis (Daily chart):
Tenkan-Sen: 10.98
Kijun-Sen: 10.47
The PBoC’s meeting with domestic cryptocurrency exchanges seems to have weighed on Ether price as well. In the hourly charts, the pair has broken below Ichimoku Cloud.
In daily charts, the pair has broken below 7-DMA and is currently trading at 11.12 levels. A close below would target 10.75 (21-DMA) and any violation would confirm further weakness in the pair, targeting 10.38 (January 27 low).
Momentum studies have turned bearish as RSI(14) is pointing south and Stochs have rolled over from the overbought zone. The weakness, however, appears to be intraday (temporary) and the overall trend remains bullish. Only a close below 21-DMA would see further bearishness.
On the upside, immediate resistance is seen at 11.55 levels and a consistent break above would see the pair testing 11.63 (January 05 high)/12 (31 October 2016 high).

- News

- Economy

- Central Banks
- Investing
- Research
- Roundups
- Digital Currency
- Insights
- Technical Analysis
- Technology
- Business
- Law
- Health
- Nature
- Fintech
- Science
- Topic
- Opinions
- ©Econometrics LLC . All Rights Reserved.
FxWirePro: ETH/USD breaks below 7-DMA, close below 10.75 confirms further weakness
Wednesday, February 8, 2017 11:07 AM UTC
Editor's Picks


- Market Data
Most Popular


