


 Silver Cracks Key 365-Day EMA for First Time Since Feb 2024; Bears Eye $50 on Rallies
  AI Memory Boom Sparks Global Chip Supply Crunch
  Bank Regulation Rollbacks in the U.S. and UK Could Increase Financial Risks, Study Warns
  Morgan Stanley Sees Chinese Auto Market Recovery Gaining Momentum in Late Summer
  SpaceX Stock Gets $175 Target as Analysts See Massive Growth Ahead
  China’s AI Manufacturing Boom Masks Weak Consumer Economy, Citi Says
  With Iran and the US signing a peace deal, where does that leave Benjamin Netanyahu?
  Goldman Sachs: US Dollar Likely to Stay Strong Despite Oil Price Retreat
  How AI prompting turned writerly description into an everyday skill
  Gold Surges Above Key EMAs, Bulls Eye Resistance Amidst Bullish Momentum


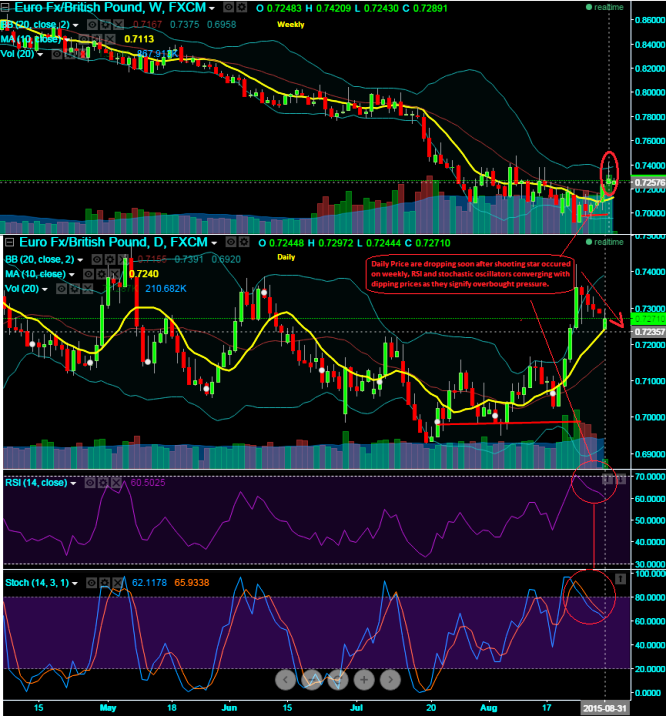
Technical briefing:
A sharp shooting star pattern candle occurred at 0.7289 on weekly technical charts that is signifying down-streak again. This pair had taken a brief pause while a slight recovery took place from 19th August, bounces from 0.7031 (lows of 19th) to 0.7420 levels. Intraday sentiments are bearish bias and leading indicators fortify these downswings with downward convergence. Things seem like taking track back onto its usual business on GBP side, the pair continues to flow its long lasting loses and held sturdy in near future.
The convergence on RSI is seen on daily charts as it is trending near 60.7820 levels with a supportive signal from stochastic curve as %D line crossover above 80 levels which indicates overbought pressure. These signals can be attributed as supportive movers for those who expect price slumps.
Trade tips: In order to participate in uptrend which is quite uncertain, bear put spread shall be used over Protective Put as the premiums on naked puts prove too costlier. Bear Put Spread = Long ATM -0.5 delta Put + Sell another -1.5% OTM Put with lower strike price with net delta should be at -0.37.
But on a swing trading perspectives, we advocate buying binary delta puts on rallies for targets of 20-25 pips. Intraday charts sell signal caused by sharp bearish candles with long real body and RSI curve is also moving in convergence with dipping prices.

- News

- Economy

- Central Banks
- Investing
- Research
- Roundups
- Digital Currency
- Insights
- Technical Analysis
- Technology
- Business
- Law
- Health
- Nature
- Fintech
- Science
- Topic
- Opinions
- ©Econometrics LLC . All Rights Reserved.
FxWirePro: EUR/GBP down streak intensifies with shooting star – prefer BPS on dubious downtrend
Monday, August 31, 2015 11:22 AM UTC
Editor's Picks


- Market Data
Most Popular


