


 FxWirePro: USD/JPY eases ahead of Fed decision , Intervention risks linger
  FxWirePro: USD/ZAR firms ahead of Fed interest rate decision
  FxWirePro: AUD/USD dips below lower range, bearish bias increases
  FxWirePro : GBP/NZD strongly bearish despite upside attempts
  FxWirePro: NZD/USD neutral in the near-term, scope for downward resumption
  Buy the Dips on EUR/JPY: Bullish Structure Points to 188 Target Ahead of Fed
  FxWirePro: USD/ CNY remains soft ahead of Fed decision
  FxWirePro: GBP/NZD maintains bersish bias with focus on 2.2900 level
  FxWirePro: USD/CAD runs out of steam but maintains bullish outlook
  FxWirePro: USD/ CNY hits one-month low,scope for futher downside
  FxWirePro: AUD/USD falls after softer-than-expected Australian Q2 CPI
  Major Forex Pairs Action Bias: GBPUSD and AUDUSD Turn Extremely Bearish
  FxWirePro: EUR/AUD regains upwards momentum but unable to hold above 50%fib level
  FxWirePro- Major Pair levels and bias summary
  FxWirePro- Woodies pivot (Major)
  FxWirePro: USD/JPY edges higher as focus shifts to BOJ decision
  FxWirePro- Major Crypto levels and bias summary


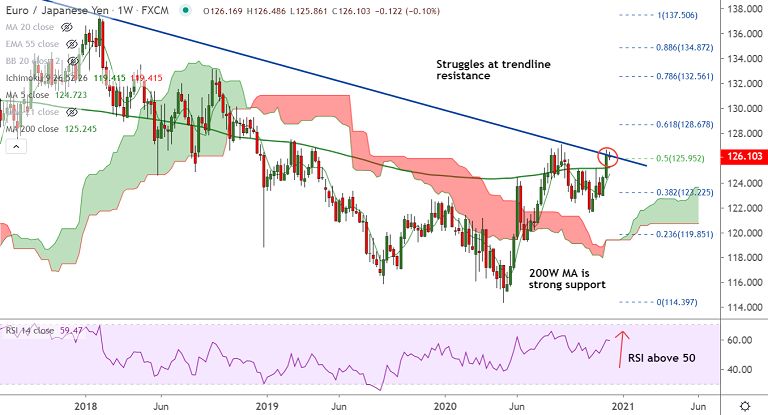
EUR/JPY chart - Trading View
Technical Analysis: Bias Neutral
- EUR/JPY struggles at major resistance at falling trendline support at 126.20
- Analysis of GMMA indicator shows major and minor trend are bullish
- Volatility is high and rising on the daily and weekly charts as evidenced by widening Bollinger bands
- Price action is consolidating previous week's break above 200W MA, which now offers strong support at 125.24
- Overbought conditions for the pair may cause minor pullbacks. Bullish invalidation only below 200W MA
Support levels - 125.24 (200W MA), 124.79 (21-EMA)
Resistance levels - 126.15 (5-DMA), 127 (Psychological mark)
Summary: Breakout above 200W MA in the previous weeks trade has raised scope for further upside in the pair. Price action finds major hurdle at trendline resistance at 126.20, decisive break above will fuel further upside. Next major bull target lies at 61.8% Fib at 128.67. Minor pullbacks likely on account of overbought oscillators. Bullish invalidation only on retrace below 200W MA.


