


 GBPJPY Weakens Amid Yen Strength: Sell on Rallies Recommended
  AUDJPY Faces Headwinds: Selling on Rallies Advised as Bearish Trend Emerges
  Despite its best efforts, Iran won’t be able to toll the Strait of Hormuz. Here’s why
  FxWirePro: GBP/USD gains some ground but outlook still bearish
  Gold Surges Above Key EMAs, Bulls Eye Resistance Amidst Bullish Momentum
  Open-Source AI Models Gain Ground as Enterprises Seek Lower-Cost Alternatives, Citi Says
  FxWirePro: USD/ZAR bears maintain upper hand
  FxWirePro: USD/JPY consolidates gains, 163 eyed
  FxWirePro: NZD/USD recovers slightly but bearish outlook persist


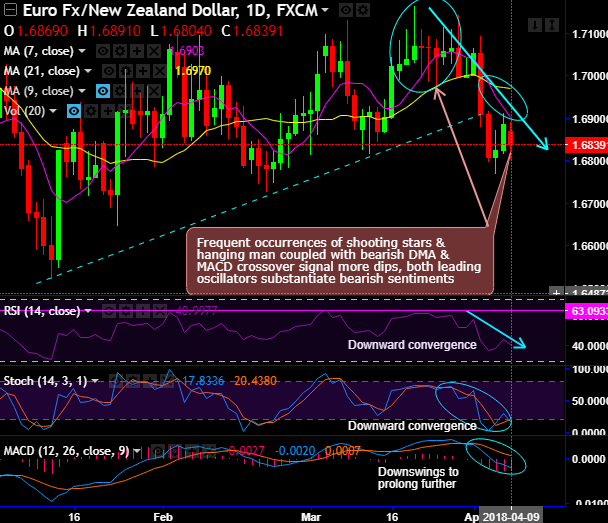
Chart and candlestick patterns formed- Back-to-back shooting stars have occurred at 1.7027, 1.7038 & 1.7070 levels and the hanging man pops up at 1.7046 levels followed by shooting stars again (refer circular area on daily chart), the breach below uptrend line on daily and attempting to breach rising channel support on weekly terms.
As a result, these bearish patterns evidence steep slumps, consequently, the current price has managed to slide below DMAs with bearish crossovers.
In between this current price behavior, bears have broken-out the uptrend line decisively.
While both leading & lagging indicators are also indicative of mounting selling interests on daily plotting.
Both RSI & stochastic curves show downward convergence to the prevailing price dips that indicate the strength and momentum goes in bears favor.
To substantiate this bearish stance, both trend indicators (DMAs and MACD) show bearish crossovers to indicate downswings to prolong further.
On a broader perspective, ever since the occurrence of hanging man at peaks of 1.7340 levels followed by spinning top, prices are plummeted and goes in non-directional as you could see a tight tug of war between bullish & bearish swings in the current trend that is stuck in the tight range between 1.7163 and 1.6522 levels (on weekly plotting).
21-DMA and 21-EMA on both daily and weekly terms respectively used to act as the strong support levels that have now broken decisively.
While RSI signals faded strength at 60 levels. Stochastic curves have also been indecisive but bearish favor. MACD also substantiates the bearish environment on this timeframe.
Trade tips:
Contemplating prevailing trend coupled with the trend and momentum indicators, it is wise to deploy upper strike at 1.6901 and lower strike at 1.6765 levels.
The implied volatility (IV) is trending just shy above 8.3% and just 1% IV represents a very static asset price. Therefore, if the asset price is sitting midway between the strike prices there is very little probability of the asset price moving far enough to become out-of-the-money and leading to a lower Tunnel value. While at the 10% price profile, it is apparent that at this higher volatility there is a higher probability the asset price will move out-of-the-money which in turn leads to a lower Tunnel value.
Currency Strength Index: FxWirePro's hourly EUR spot index is inching towards 26 levels (mildly bullish), while hourly NZD spot index was at 113 (highly bullish) while articulating at 09:25 GMT. For more details on the index, please refer below weblink:
http://www.fxwirepro.com/currencyindex.
FxWirePro launches Absolute Return Managed Program. For more details, visit:


