


 Goldman Sachs: US Dollar Likely to Stay Strong Despite Oil Price Retreat
  Trump’s Iran Strategy: What Has Been Achieved After Three Months of Conflict?
  Sell the Bounce": Gold Rally Stalls Near $4165 as Fed Hawks Slam the Door on Rate Cuts — Targets $4000/$3600
  Today’s space race could turn fatal if we don’t agree on new rules
  Gold's 365-Day EMA Streak Since Oct 2023 Faces Its First Real Test at $3,980 — Break or Bounce to $4,140?
  Bank Regulation Rollbacks in the U.S. and UK Could Increase Financial Risks, Study Warns
  SpaceX Stock Gets $175 Target as Analysts See Massive Growth Ahead
  World Cup technology: from ref cams to AI analysts, cutting-edge research is changing the game


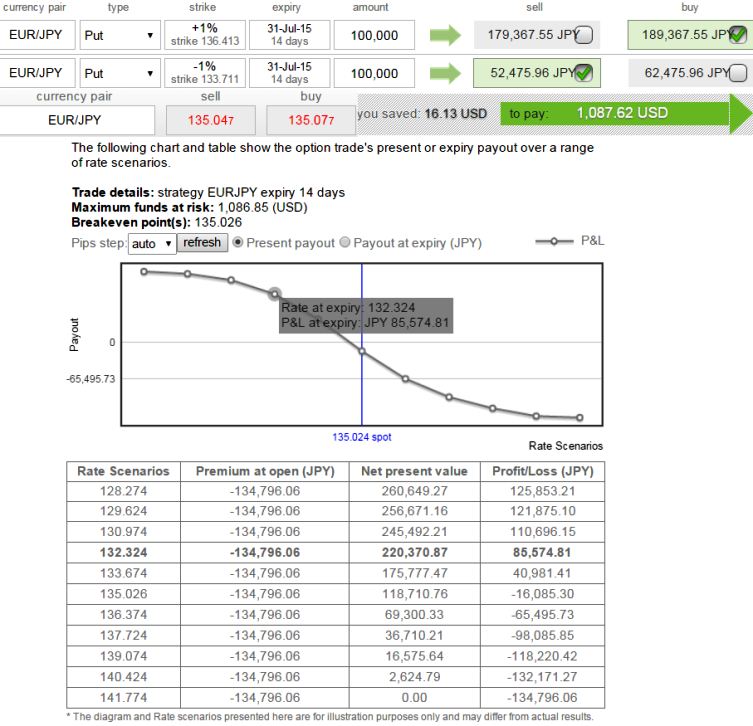
EOD chart of EUR/JPY evidences the back to back bearish candlestick patterns on downswings to confirm short term downtrend. It is observed that formation of gravestone doji at 135.794 followed by one more doji at 135.811 to suggest reversal & a bit of correction.
While these bearish sentiments are fortified by oscillating indicator such as slow stochastic signals overbought on weekly charts.
RSI (14) converging downward sign at 44.0624 and %D line crossover above 80 levels indicate overbought situation. (Currently %D line = 63.7319 & %K line = 38.7535).
If the pair fails to test support levels at 135 levels then it would undoubtedly drag until 133.676 & then 131.75 levels can't be disregarded.
Hence, downside risks on this pair are perceived foreign trades are advised to hedge Euro's exposure to arrest its currency depreciation. On a purely medium term hedging perspective, debit put spreads are advocated as the selling indications are piling up on weekly graph.
In order to execute this strategy, long either an ATM or ITM Put option and short another OTM Put option at a lower strike price for a net debit.
Use this position over a necked long put only when necked puts are overpriced or the underlying currency is expected to move marginally lower.
So by selling 14D (-1%) Out-Of-The-Money put option reduces the cost of hedging through financing this in long position of 14D (+1%) In-The-Money -0.69 delta Puts.
We can make out from the diagram that how varied exchange rates yields different payoffs, and any steep declines will be taken care by long put position as ITM strike price at 136.335 would enable holder to exercise his right to sell in spot FX or respective option premiums would flourish while short side would reduce the hedging cost by ¥52475.96.

- News

- Economy

- Central Banks
- Investing
- Research
- Roundups
- Digital Currency
- Insights
- Technical Analysis
- Technology
- Business
- Law
- Health
- Nature
- Fintech
- Science
- Topic
- Opinions
- ©Econometrics LLC . All Rights Reserved.
FxWirePro: EURJPY debit put spread reduces downside risks and hedging cost
Friday, July 17, 2015 6:42 AM UTC
Editor's Picks


- Market Data
Most Popular


