


 Gold Surges Above $4100 on Weak US Jobs Data; Bullish Momentum Builds
  Vietnam’s population hit the 100 million milestone. Where’s it headed?
  GBPJPY Surges on Yen Weakness; Bullish Trend Favors Dip Buying
  USA at 250: the Black American struggle for life, liberty and the pursuit of happiness
  FxWirePro USD/JPY eases slightly ahead Of US June jobs report
  FxWirePro: USD/CAD slips on softer US payrolls but near-term direction hinges on 1.4154 support
  FxWirePro- Woodies pivot (Major)
  FxWirePro: USD/ZAR slips as weak U.S. Jobs data weighs on dollar
  Alcohol is one of the most dangerous drugs, yet its presence is ubiquitous in social settings and celebrations
  EURJPY Plunges Below 184 Amidst Yen Strength: Bearish Outlook Persists
  FxWirePro: USD/CAD steadies around 1.4220 ,retains bid one
  FxWirePro- Major Pair levels and bias summary
  Morgan Stanley Names BAE Systems Top European Defence Stock Despite Lower Price Target


The flurry of bearish streaks in Gold prices was traced out just a fortnight ago that has evidenced considerable price slumps, while the consolidation phase in the major trend also seems to have been exhausted at around 38.2% Fibonacci retracement levels.
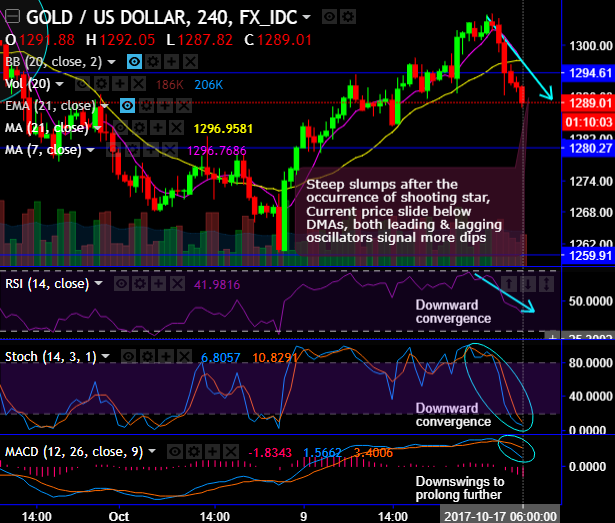
Historically, hanging man and shooting star pattern candles have occurred at 1321.49 and 1308.76 levels respectively, that is where the stiff resistance at the same level was observed (refer monthly chart to see the strong supply zone). In July and September 2016, you could observe the similar resistance levels at this juncture. And for now, in September 2017, we’ve seen steep slumps after peaking to the same level.
You could expect more bearish streaks going forward as 7DMA most likely to cross below 21DMA which is a bearish DMA crossover.
While both leading oscillators (RSI & Stochastic curves) evidence downward convergence to the prevailing price dips. This signals the strength and intensified momentum in selling interests.
To substantiate this bearish stance, MACD, on the other hand, also shows bearish crossover to indicate the downswings to prolong further.
Never get puzzled by major trend – The major trend seems to be exhausted before retracing 38.2% Fibonacci levels from the lows of 1046.54. Historically, the prices in this consolidation phase are plummeted at the same level by popping up shooting star candle pattern (refer monthly chart).
Consequently, you could very well observe its bearish effects as both momentum and trend indicators on this time frame don’t give a better clarity for further continuity of consolidation phase. Overall, we reiterate that the prices have rejected the stiff resistance zone of 1357 – 1382 levels several times in past, it has again shown the weakness at that level.
To participate and speculate this bearish streaks, we advocate tunnel spreads using upper strikes at 1292 and lower strikes at 1285, prefer narrowed tenors in order to have the time decay advantage.
Currency Strength Index: FxWirePro's hourly USD spot index is flashing 42 (which is bullish) while articulating at 09:23 GMT. For more details on the index, please refer below weblink:
http://www.fxwirepro.com/currencyindex.
FxWirePro launches Absolute Return Managed Program. For more details, visit:


