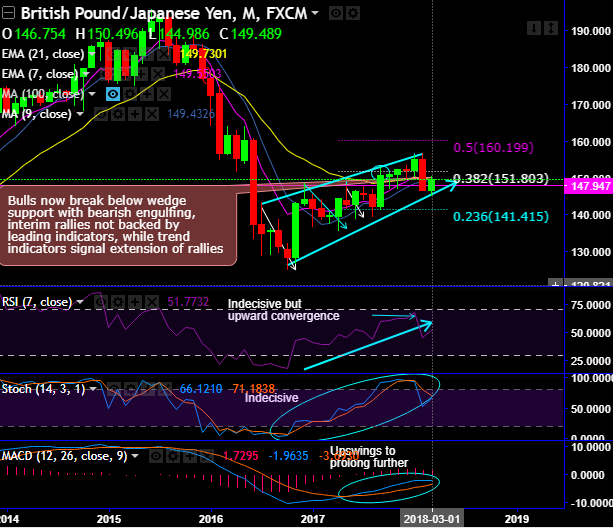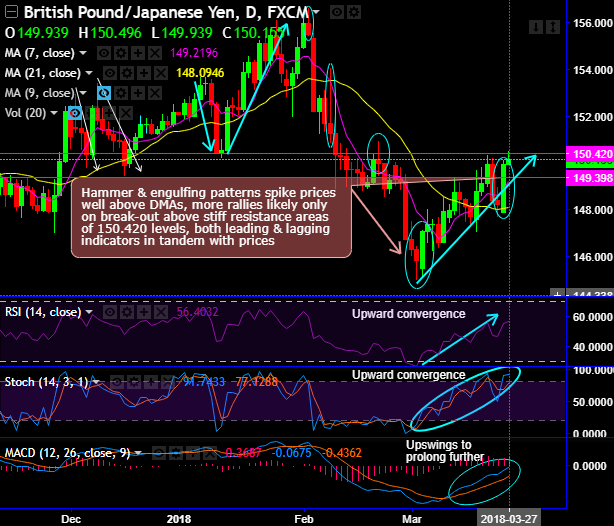
Chart and candlestick patterns occurred: Minor trend forms hammer and bullish engulfing patterns. The intermediate trend has been spiking through rising wedge pattern which is bullish in nature.
Hammer occurred at 145.831 levels and the bullish engulfing pattern has occurred at 147.065 and 149.939 levels yesterday that take off rallies well above DMAs (refer daily chart), consequently, the upswings attempt to break-out stiff resistance at 150.420 levels.
On the contrary, the consolidation phase has been edgy in the stiff resistance areas of 152.121 - 153. 600 and attempting to dip below 7EMAs in the recent history, the hanging man has occurred on monthly plotting at around 152.208 levels, ever since the occurrence of this bearish pattern, rallies struggled for bullish momentum so far.
The pair pops up hanging man at or near 38.2% Fibonacci retracement levels (at 152.121 levels) in the consolidation phase, ever since then the bulls seem to have given up their pace and showing weakness (refer monthly plotting). The current price is trading at the same levels.
The above-stated candle patterns (hammer and bullish engulfing) are bullish in nature that prop up bullish momentum in the consolidation phase of the major trend, if we see the sustenance above 150.420 levels, a retracement upto 38.2% level seems most likely to drag price rallies.
The stochastic oscillator on monthly terms has entered into overbought trajectory but has been indecisive, bullish though.
While RSI on the daily chart has been converging to the price rallies to signal the strength in the buying interests, slightly indecisive on monthly terms.
While MACD to substantiate bullish interests, signals extension of price rallies monthly terms.
Trade tips:
On speculative grounds, at spot reference: 1.7320 we advocate buying double touch call options choosing strikes at 150.420 to bet on a journey towards next stiff resistance upto 153.530 levels.
Alternatively, with a view to arresting potential downside risks, deploy shorts in futures contracts of mid-month tenors.
Currency Strength Index: FxWirePro's hourly GBP spot index is flashing -99 (which is bearish), while hourly JPY spot index was at -23 (bearish) while articulating (at 08:06 GMT). For more details on the index, please refer below weblink:
http://www.fxwirepro.com/currencyindex.
FxWirePro launches Absolute Return Managed Program. For more details, visit: