


 How Donald Trump has changed the way diplomacy is done
  Sell the Bounce": Gold Rally Stalls Near $4165 as Fed Hawks Slam the Door on Rate Cuts — Targets $4000/$3600
  Silver Cracks Key 365-Day EMA for First Time Since Feb 2024; Bears Eye $50 on Rallies
  J.P. Morgan Sees Potential Vestas Guidance Upgrade Amid Strong Wind Energy Demand
  World Cup technology: from ref cams to AI analysts, cutting-edge research is changing the game
  Gold's 365-Day EMA Streak Since Oct 2023 Faces Its First Real Test at $3,980 — Break or Bounce to $4,140?
  China’s AI Manufacturing Boom Masks Weak Consumer Economy, Citi Says
  Morgan Stanley Sees Chinese Auto Market Recovery Gaining Momentum in Late Summer
  AI Memory Boom Sparks Global Chip Supply Crunch
  With Iran and the US signing a peace deal, where does that leave Benjamin Netanyahu?


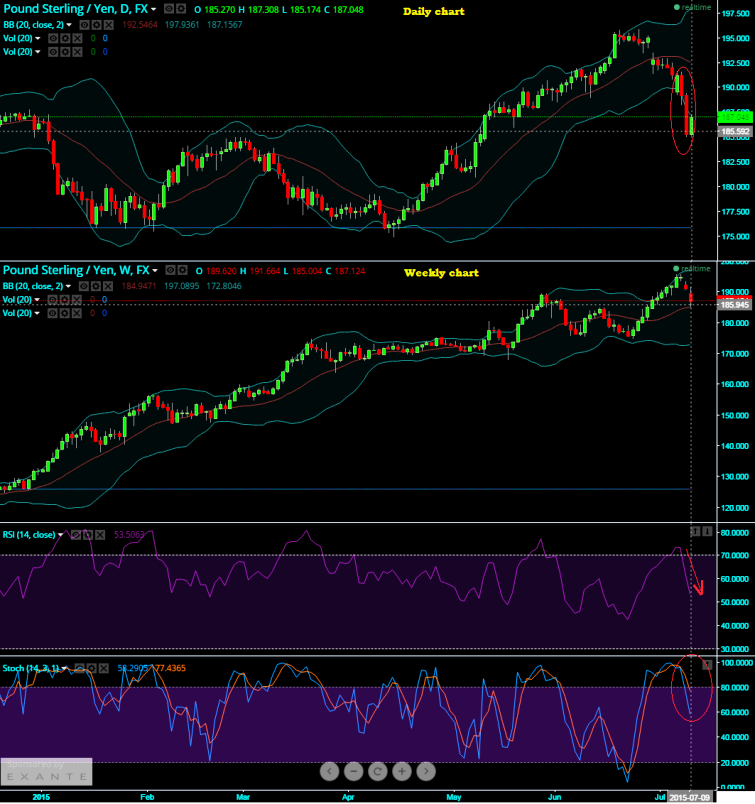
Technical glance:
On daily chart of this pair shows we have referred to the engulfing bearish like candlestick pattern yesterday, see what's been happened on yesterday's GBP/JPY candle. One can read and obtain much information from a candle; here an engulfing like pattern candle which means an earlier trend reversal continues to hold.
Engulfing bear followed by one more bearish candle with long real body is traced out on daily charts which is a signal of weakness.
On weekly data, the weakness traced above is confirmed by oscillators with downward convergence to the price line.
RSI (14): 53.5716, converging with falling prices.
Stochastic: %D line 77.5413; %K line 58.6233 crossover above 80 levels signaling a clear overbought scene.
Currency Derivatives Insights: (GBP/JPY)
Arrest downside risks of these pairs hedging through deploying option strategy: Put Ratio back Spread.
Expect the underlying currency (GBPJPY in this case) to make a large move on the downside.
Purchase puts and sell fewer puts of a higher strike (ITM) in a ratio of 2:1 or 3:1.
The higher strike short puts finances the purchase of the greater number of long puts and the position is entered for no cost or a net credit.
The underlying exchange rate of GBP has to make substantial move on the downside for the gains in long puts to overcome the losses in the short puts as the maximum loss is at the long strike.
Give it a longer time to expiration so as to make a substantial move on the downside.

- News

- Economy

- Central Banks
- Investing
- Research
- Roundups
- Digital Currency
- Insights
- Technical Analysis
- Technology
- Business
- Law
- Health
- Nature
- Fintech
- Science
- Topic
- Opinions
- ©Econometrics LLC . All Rights Reserved.
FxWirePro: GBP/JPY engulfing bear confirmed by long real body candle; prefer PRBS on hedging front
Thursday, July 9, 2015 6:12 AM UTC
Editor's Picks


- Market Data
Most Popular


