


 Jamie Dimon Warns Anthropic's Mythos AI Poses National Security Risks
  Goldman Sachs Raises USD/JPY Forecast, Sees Yen Weakness Persist Through 2027
  Goldman Sachs Flags 3 Key Risks Ahead of Europe’s Earnings Season
  Goldman AM Sees Strong Buyout Opportunities in Japan, South Korea and Australia
  Bernstein Names IAG, Ryanair as Top European Airline Stocks Ahead of Earnings
  UBS Boosts China Tech Bets, Adds Kuaishou and Meituan to Focus List
  Morgan Stanley Names Marks & Spencer Top European Retail Pick, Sees Strong Upside


 - EconoTimes)


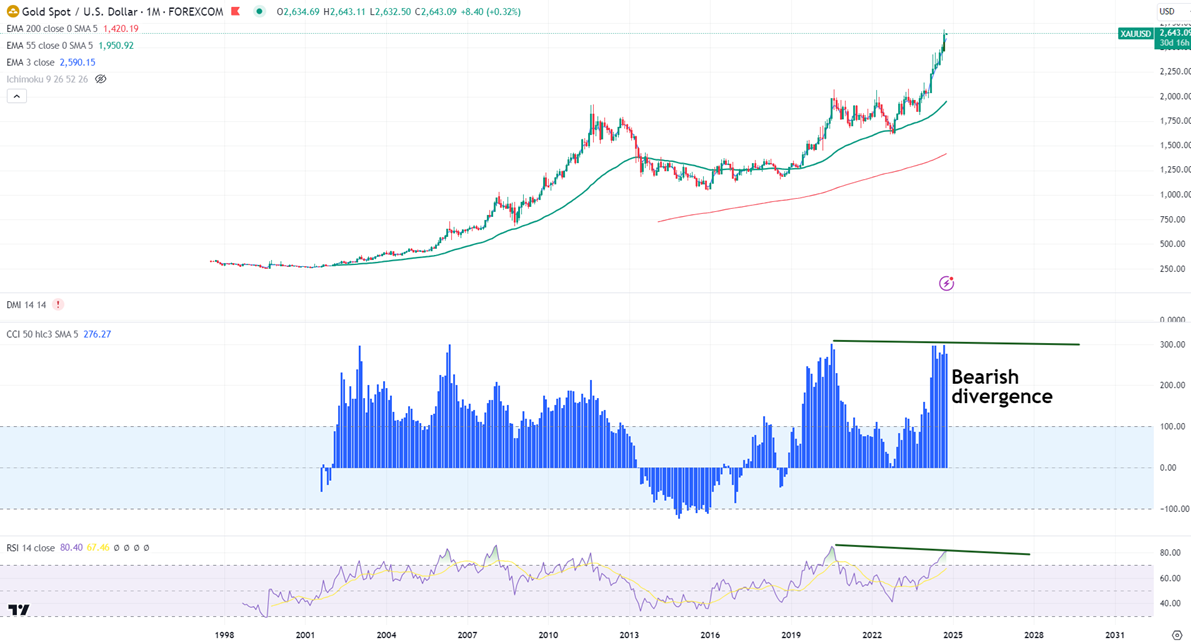
Bearish Divergence CCI (50)
Gold was one of the best performers the previous month on board-based US dollar weakness. It hits a all-time high of $2685 and is currently trading around $2640.
Central Banks-
The monetary easing by major central banks like Fed, ECB, BOC, and SNB to push the global economy has increased the demand for safe-haven assets like gold.
US CPI, PPI, and PCE came below the market forecast. The slowing job growth and market dynamics also increase the chance of further rate cut by the fed.
Fed cuts rates by 50 bpbs in Sep policy meeting. Markets expect further aggressive easing by the Fed due to easing inflation.
According to the CME Fed watch tool, the probability of a 25 bpbs rate cut in Nov decreased to 61.8% from 41.8% a week ago.
Technical (monthly chart)-
In the monthly chart, the yellow metal trades above the short-term (34 and 55 EMA ) and long-term (200- EMA) EMAs.
The near–term support is around $2620, a break below targets of $2589 (2.36% fib)/$2539/$2470—major bearish continuation only below $2470.The yellow metal faces minor resistance around $2685 and a breach above will take it to the next level of $2722/$2750.
Indicator (Monthly chart)
CCI (50)- Bullish (bearish divergence)
Average directional movement Index - Bullish
RSI- 83.50 (Overbought)
It is good to sell on rallies around $2661-62 with SL around $2685 for a TP of $2540.


