


 Energy Sector Outlook 2025: AI's Role and Market Dynamics
  European Stocks Rally on Chinese Growth and Mining Merger Speculation
  Stock Futures Dip as Investors Await Key Payrolls Data
  S&P 500 Relies on Tech for Growth in Q4 2024, Says Barclays
  Moldova Criticizes Russia Amid Transdniestria Energy Crisis
  Mexico's Undervalued Equity Market Offers Long-Term Investment Potential
  Geopolitical Shocks That Could Reshape Financial Markets in 2025
  US Futures Rise as Investors Eye Earnings, Inflation Data, and Wildfire Impacts
  Lithium Market Poised for Recovery Amid Supply Cuts and Rising Demand
  Gold Prices Fall Amid Rate Jitters; Copper Steady as China Stimulus Eyed
  Trump’s "Shock and Awe" Agenda: Executive Orders from Day One
  Bank of America Posts Strong Q4 2024 Results, Shares Rise
  Urban studies: Doing research when every city is different
  UBS Predicts Potential Fed Rate Cut Amid Strong US Economic Data
  Wall Street Analysts Weigh in on Latest NFP Data
  U.S. Stocks vs. Bonds: Are Diverging Valuations Signaling a Shift?
  Moody's Upgrades Argentina's Credit Rating Amid Economic Reforms


 - EconoTimes)


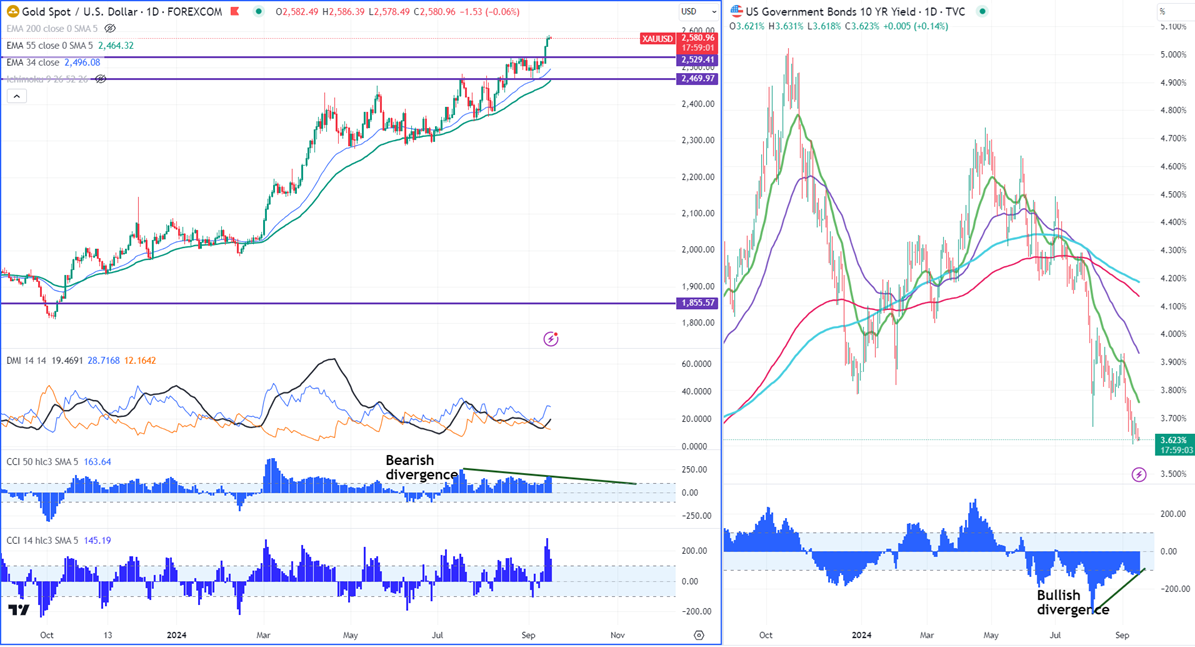
Gold hits fresh all-time high ahead of US fed monetary policy. It hit a high of $2589.71 and is currently trading around $2584.30.
Chart pattern
Gold- CCI (50) Bearish divergence (Daily chart)
US 10-year yield - CCI (50) Bullish divergence (Daily chart)
According to the CME Fed watch tool, the probability of a 50 bpbs rate cut in Sep increased to 67% from 30% a week ago.
US dollar index- Bearish. Minor support around 100.50/99.80. The near-term resistance is 101.40/102.
Factors to watch for gold price action-
Global stock market- Bullish (Negative for gold)
US dollar index - Bearish (Positive for gold)
US10-year bond yield- Bearish (positive for gold)
Technical:
The near–term support is around $2570, a break below the target of $2560/$2544/$2535/$2520. The yellow metal faces minor resistance around $2590 and a breach above will take it to the next level of $2622/$2650.
Indicator (Daily chart)
CCI (14)- Bullish
CCI (50)- Bullish
Average directional movement Index - Bullish
It is good to sell on rallies around $2584-85 with SL around $2600 for TP of $2545/$2520.


