


 Trump’s Iran Strategy: What Has Been Achieved After Three Months of Conflict?
  Silver Cracks Key 365-Day EMA for First Time Since Feb 2024; Bears Eye $50 on Rallies
  Sell the Bounce": Gold Rally Stalls Near $4165 as Fed Hawks Slam the Door on Rate Cuts — Targets $4000/$3600
  How Donald Trump has changed the way diplomacy is done
  Gold's 365-Day EMA Streak Since Oct 2023 Faces Its First Real Test at $3,980 — Break or Bounce to $4,140?
  SpaceX Stock Gets $175 Target as Analysts See Massive Growth Ahead
  AI Memory Boom Sparks Global Chip Supply Crunch
  Today’s space race could turn fatal if we don’t agree on new rules
  China’s AI Manufacturing Boom Masks Weak Consumer Economy, Citi Says
  Morgan Stanley Sees Chinese Auto Market Recovery Gaining Momentum in Late Summer
  World Cup technology: from ref cams to AI analysts, cutting-edge research is changing the game


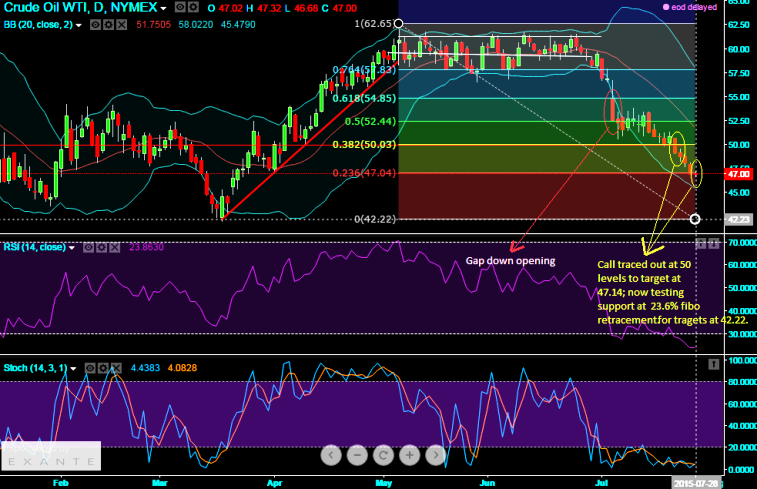
On EOD charts of WTI CL1! We had traced out an inverse saucer pattern and call for targets at 47.14. Today it is very well achieved with day's low of 46.68 levels. Inverse saucer patterns can prolong for weeks or even extend into years. But for now the new trend that develops may last a similar duration to the previous trend it reversed at 60.27 levels.
This unusual formation evidences no clear price targets but usually implies quite a lot of potential since 50% or more retracement of the preceding uptrend can be expected. At the current levels this commodity price is testing a significant supports at 47 levels which is 38.2% retracement from peaks of previous uptrend.
Volume during inverse saucers formation with gap down opening at 54.90 resembles the bowl-like shape of prices during a saucer. Volume which was spiking high during such uptrend beginning (zone 42-60 as shown by red trendline) and then began cooling off as the expectations shift and again traders become indecisive during early May 2015 to end June 2015 (prices moved in a channel line as shown blue colored trendlines), Volume then increases as the new trend is established. We think any breach below the supports at 47 levels would certainly drag this commodity until 42.22 levels.

- News

- Economy

- Central Banks
- Investing
- Research
- Roundups
- Digital Currency
- Insights
- Technical Analysis
- Technology
- Business
- Law
- Health
- Nature
- Fintech
- Science
- Topic
- Opinions
- ©Econometrics LLC . All Rights Reserved.
FxWirePro: Inverse saucer pattern forms on WTI crude, testing supports at 23.6% Fibo retracement, any breach below drags next target to 42.22
Tuesday, July 28, 2015 10:30 AM UTC
Editor's Picks


- Market Data
Most Popular


