


 FxWirePro- Major Crypto levels and bias summary
  NEAR Protocol Leads AI Crypto Rally Amid Fed Rate Hike Fears
  Kalshi Seeks Sixth Circuit Review of Sports Betting Ruling
  Monero Price Holds $515 Support as XMR Eyes $545 Breakout
  MNX Crypto Exchange Launches Futures for OpenAI, Anthropic Valuations
  XRP Price Drops 3% Despite Ripple-Backed Evernorth Nasdaq Debut
  Wells Fargo Expands Stablecoin Plans With 20 Major Banks
  Cardano Price Drops 15% as Whales Sell 110 Million ADA
  BTCUSD Rebounds Past $83K as Risk Appetite Returns Despite Choppy ETF Flows
  Citi Upgrades Galaxy Digital Stock, Raises Price Target to $28


 Add as a preferred source on Google
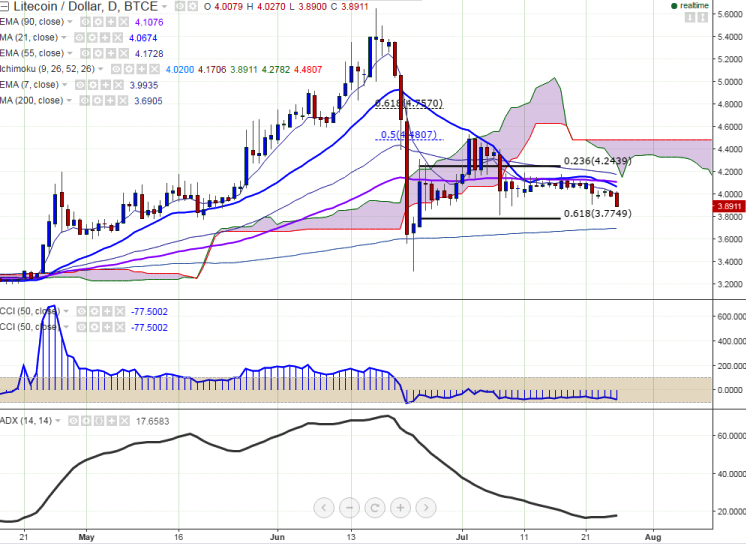
LTC/USD is seen plunging well below on Tuesday. The pair has retreated after making a high of $4.0340 (BTCE) yesterday. It is currently trading around $3.92 at the time of writing.
Ichimoku analysis of daily chart shows:
Tenkan-Sen $4.040
Kijun-Sen $4.17
Trend reversal - $4.11
Long-term trend remains to be bullish. The short- term trend seems to be bearish. In the daily chart, the pair is trading well below Tenkan-Sen and kijun-Sen. So a decline till $3.68/$3.31is possible.
Major resistance is seen at $4.0277 (7 days EMA) and any break above will take the pair till $4.089 (21 days MA)/$4.1832 (55 days EMA). Major support can be observed at $3.90 (Jul 22nd low) and break below will drag the pair till $3.68 (200 days MA)/$3.31 (200 day MA).

- News

- Economy

- Central Banks
- Investing
- Research
- Roundups
- Digital Currency
- Insights
- Technical Analysis
- Technology
- Business
- Law
- Health
- Nature
- Fintech
- Science
- Topic
- Opinions
- ©Econometrics LLC . All Rights Reserved.
FxWirePro: LTC/USD trades well below $4 level, targets $3.68/$3.31
Tuesday, July 26, 2016 12:03 PM UTC
Editor's Picks



- Market Data
Most Popular




