


 Moody's Upgrades Argentina's Credit Rating Amid Economic Reforms
  Goldman Predicts 50% Odds of 10% U.S. Tariff on Copper by Q1 Close
  UBS Projects Mixed Market Outlook for 2025 Amid Trump Policy Uncertainty
  Gold Prices Fall Amid Rate Jitters; Copper Steady as China Stimulus Eyed
  Moldova Criticizes Russia Amid Transdniestria Energy Crisis
  Lithium Market Poised for Recovery Amid Supply Cuts and Rising Demand
  Stock Futures Dip as Investors Await Key Payrolls Data
  U.S. Stocks vs. Bonds: Are Diverging Valuations Signaling a Shift?
  Global Markets React to Strong U.S. Jobs Data and Rising Yields
  Indonesia Surprises Markets with Interest Rate Cut Amid Currency Pressure
  China’s Growth Faces Structural Challenges Amid Doubts Over Data
  Geopolitical Shocks That Could Reshape Financial Markets in 2025
  Trump’s "Shock and Awe" Agenda: Executive Orders from Day One
  Gold Prices Slide as Rate Cut Prospects Diminish; Copper Gains on China Stimulus Hopes
  S&P 500 Relies on Tech for Growth in Q4 2024, Says Barclays
  European Stocks Rally on Chinese Growth and Mining Merger Speculation
  Wall Street Analysts Weigh in on Latest NFP Data


A quick glance at crude fundamentals: The rally in energy prices persisted into end 3Q’18, given potential supply shocks emanating especially from Iranian sanctions amid OPEC’s reluctance to lift production in response. Moreover, Saudi Arabia’s rhetoric to stay “content” should prices at $80/bbl or higher could have given investors a price target.
However, Fundamentals are exhibiting distinctive atmosphere: OPEC’s oil production since May 2018 when Iranian sanctions were announced were decisively higher, with higher supplies seen from Saudi Arabia, Russia and Iraq. The upside in oil production have in fact outweighed the lower production seen in Iran and Venezuela.
Demand trend from oil importing economies were also slower in the first seven- eight months of 2018.
Iran’s crude oil production accounts for roughly 12% of total OPEC oil production, and is the third largest producer in the OPEC cartel. Since the US decision to place Iran under sanctions in May 2018, Iranian crude oil production has fallen by 300,000 barrels per day (bpd) into August 2018. Compare this with Iran’s fall in production by 1.3 million bpd back in 2010 – 2013 during the previous US-led sanctions may lead one to believe that further production shortfalls can be expected into 2019.
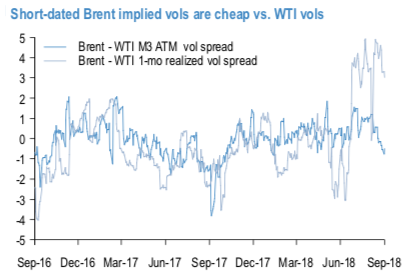
Crude oil vols set-up: The relative vol set-up in Brent and WTI options is amenable to complementing a cash arb position with a long Brent call vs. short WTI call option switch. M3 Brent ATM vols are priced at a 0.5 % pt. discount to M3 WTI ATMs, even as trailing 1m and 3m realized vols in Brent have outstripped WTI by 3-5 pts (refer 1stchart). The implied vs. realized vol disconnect also extends to directional RVs: we find that OTM WTI calls are priced much too expensive relative to Brent calls given the history of their flat price movements.
The 2ndchart exhibits a conditional trade framework for evaluating relative rich/cheap for directional options as applied to Brent vs WTI.
An isopremium line of Jan’19 options – a string of zero-cost long Brent vs. short WTI option strikes, presented on both axes as their percentage distance from respective flat prices (i.e. % OTM) – is overlaid on a scatter of 2-month price returns; the slope of the isopremium line can be interpreted as the option-implied beta between the two assets, which can be compared against the historical spot return beta for an assessment of relative value. The stark asymmetry of option pricing vis-à-vis spot returns on the graphic – a large fraction of the historical return scatter is below the isopremium line for Brent moves north of 5% (highlighted on the chart) – suggests that crude options are anticipating excessive rallies in WTI for a given rally in Brent than has commonly been delivered.
A zero-cost long BRT vs. short WTI option spread using the strikes in the chart takes advantage of this misalignment, and in effect expresses a contingent view of Brent outperformance: conditional on an oil price rally, Brent is expected to outperform WTI relative to option market expectations; if oil prices fall instead, both call options expire worthless and there is no P/L impact.
We recommend the following: Off Jan’19 future refs. 77.865 (Brent) and 69.87 (WTI), buy Jan’19 expiry 82 strike Brent call (35-delta) vs. sell Jan’19 74 strike WTI calls (35-delta). Courtesy: OCBC, JPM
Currency Strength Index: FxWirePro's hourly USD spot index is inching towards 2 levels (which is neutral), while articulating (at 10:42 GMT). For more details on the index, please refer below weblink:


