


 FxWirePro: USD/ZAR surges as rand slumps after SARB rate hold surprise
  FxWirePro- Woodies pivot (Major)
  NZDJPY Bullish Dip-Buy Setup: 93.60 Support Unlocks Path to 97
  EUR/USD Slides After ECB Hold, Bearish Technicals Favor Rally Fades
  FxWirePro: AUD/USD uptrend loses steam, remains on bearish path
  FxWirePro: GBP/AUD bears maintain upper hand
  FxWirePro: USD/CAD positions for another climb, eyes 1.4150 level
  BTC, ETH, SOL, XRP, and BNB: Major Crypto Pairs Stay Neutral
  FxWirePro: GBP/NZD downside pressure builds, key support levels in focus
  Crypto Bias Report: Trend Signals and Top Bullish Picks
  FxWirePro: EUR/AUD neutral in the near term, scope for downward resumption
  FxWirePro: EUR/NZD firms after ECB holds rates steady at 2.25%
  FxWirePro: USD/CNY edges higher but bulls lack punch
  FxWirePro- Major Crypto levels and bias summary
  JPY Action Bias: USDJPY, EURJPY, and CADJPY Emerge as Top Extremely Bullish Picks
  FxWirePro: GBP/USD slips as middle east tensions and oil surge pressure pound


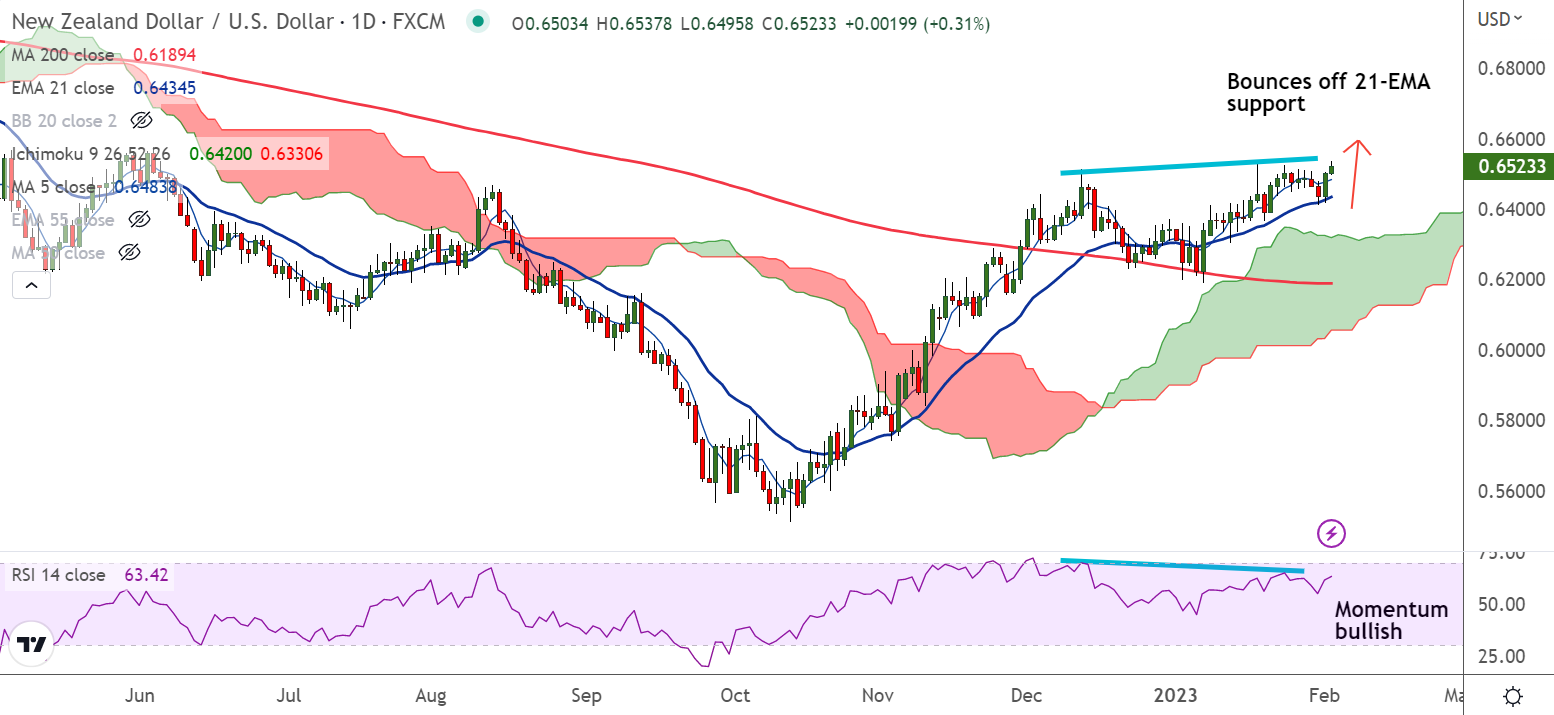
Chart - Courtesy Trading View
Technical Analysis:
- NZD/USD was trading 0.23% higher on the day at 0.6519 at around 13:10 GMT
- The pair is extending gains for the second straight session after bounce off 21-EMA support on Wednesday
- Price action is above daily cloud and Chikou span is biased higher
- GMMA indicator shows major and minor trend are bullish
- Momentum is bullish, MACD and ADX support upside in the pair
- Bearish RSI divergence on the daily charts keeps scope for downside
Support levels:
S1: 0.6482 (5-DMA)
S2: 0.6434 (21-EMA)
Resistance levels:
R1: 0.6544 (Upper BB)
R2: 0.6613 (200-week MA)
Summary: NZD/USD trades with a bullish bias. The pair is poised to test 200-week MA at 0.6613. On the flipside, break below 21-EMA will see dip till daily cloud. Major weakness only below 200-DMA.


