


 FxWirePro: GBP/USD slides toward critical support market reassesses UK political transition
  Sterling Slump Sends GBPJPY Toward 212.60 — Bearish EMA Stack Eyes 210
  FxWirePro: USD/JPY edges higher as the yen remains vulnerable despite repeated warnings of intervention.
  Energy Sector Outlook 2025: AI's Role and Market Dynamics
  Indonesia Surprises Markets with Interest Rate Cut Amid Currency Pressure
  BTC Slips Below $60K as Institutional Demand Dries Up — Bears Eye $59K Support, Rallies to $63K for Shorts
  U.S. Stocks vs. Bonds: Are Diverging Valuations Signaling a Shift?
  China’s Growth Faces Structural Challenges Amid Doubts Over Data
  Bitcoin Sheds $491M in ETF Outflows and Retreats Below $64K; Sellers Reload for $50K
  S&P 500 Relies on Tech for Growth in Q4 2024, Says Barclays
  FxWirePro: NZD/USD downside pressure builds, key support level in focus
  AUDJPY Breaks Key Trendline Support — Bears Eye 110 as Momentum Accelerates
  Moldova Criticizes Russia Amid Transdniestria Energy Crisis
  China's Refining Industry Faces Major Shakeup Amid Challenges
  Geopolitical Shocks That Could Reshape Financial Markets in 2025
  NZDJPY: The Kiwi Yen's Bull Run Hits a Brick Wall at 92 — Sell the Rally?
  EURJPY Bounce Loses Steam Below 184 — Sell-the-Rally Setup Eyes 183 Target


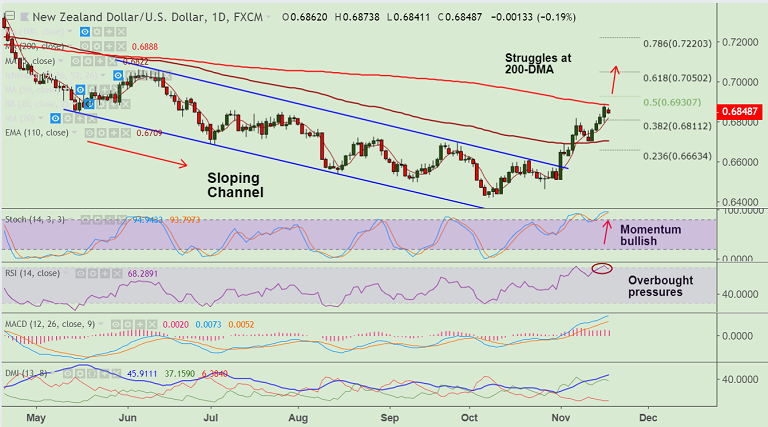
NZD/USD chart on Trading View used for analysis
- NZD/USD slips further from 5-month high at 0.6883 hit on Friday's trade.
- The pair is struggling at stiff resistance at 200-DMA, further upside only on break above.
- We see some overbought pressures on momentum indicators which suggests possibility of pullbacks.
- Immediate support lies at 5-DMA at 0.6820, break below to see dip till 110-EMA at 0.6709.
- On the upside, breakout at 200-DMA to see test of 61.8% Fib at 0.7050.
Support levels - 0.6820 (5-DMA), 0.6709 (110-EMA)
Resistance levels - 0.6888 (200-DMA), 0.7050 (61.8% Fib)
For details on FxWirePro's Currency Strength Index, visit http://www.fxwirepro.com/currencyindex.


