


 SpaceX Stock Gets $175 Target as Analysts See Massive Growth Ahead
  With Iran and the US signing a peace deal, where does that leave Benjamin Netanyahu?
  China’s AI Manufacturing Boom Masks Weak Consumer Economy, Citi Says
  Silver Cracks Key 365-Day EMA for First Time Since Feb 2024; Bears Eye $50 on Rallies
  Bank Regulation Rollbacks in the U.S. and UK Could Increase Financial Risks, Study Warns
  J.P. Morgan Sees Potential Vestas Guidance Upgrade Amid Strong Wind Energy Demand
  Today’s space race could turn fatal if we don’t agree on new rules
  Trump’s Iran Strategy: What Has Been Achieved After Three Months of Conflict?
  Sell the Bounce": Gold Rally Stalls Near $4165 as Fed Hawks Slam the Door on Rate Cuts — Targets $4000/$3600
  Goldman Sachs: US Dollar Likely to Stay Strong Despite Oil Price Retreat
  How AI prompting turned writerly description into an everyday skill
  How Donald Trump has changed the way diplomacy is done


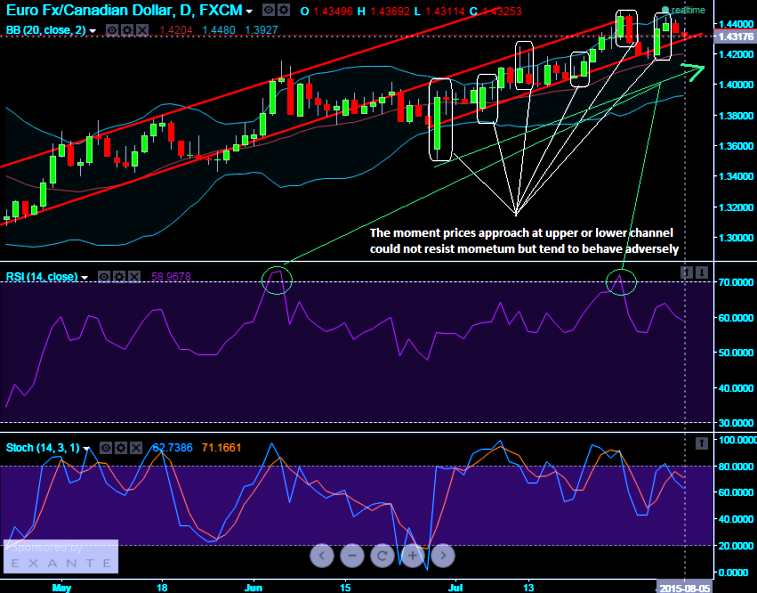
Technical Observation:
- RSI indicates uptrend is healthier: In addition to that, leading oscillators are showing convergence according to the price fluctuations, we have not seen any divergent relations to the prices. RSI (14) looks healthily converging with every price rises and dips, since 04th June it has only approached oversold zone once on 27th July. So, RSI signifies the prevailing uptrend remains intact.
- Stochastic and upper channel: While another leading oscillator (stochastic) hints us the overbought heaviness the moment pair hits upper channel line as the %D line crossover is seen above 80 levels.
- Bollinger band and RSI: The moment when prices crosses over upper Bollinger band more vigorously, only then RSI shows overbought scenes, otherwise RSI states prices are in sync with uptrend momentum.
- Channel line: From last one month it is observed that the Euro Canadian pair has been moving in 2nd channel line band width of 270-280 pips. As shown in the diagram it is quite important to note that if prices are trying to break this range then the very next day there would be adverse price reactions which would mean that the major tolerance level for price is around 270 pips. Option traders with speculating perspectives are advised to use futures contracts considering targets of the range as stated above.


