


 UBS Projects Mixed Market Outlook for 2025 Amid Trump Policy Uncertainty
  Wall Street Analysts Weigh in on Latest NFP Data
  Urban studies: Doing research when every city is different
  S&P 500 Relies on Tech for Growth in Q4 2024, Says Barclays
  Global Markets React to Strong U.S. Jobs Data and Rising Yields
  Oil Prices Dip Slightly Amid Focus on Russian Sanctions and U.S. Inflation Data
  U.S. Treasury Yields Expected to Decline Amid Cooling Economic Pressures
  Geopolitical Shocks That Could Reshape Financial Markets in 2025
  Moldova Criticizes Russia Amid Transdniestria Energy Crisis
  UBS Predicts Potential Fed Rate Cut Amid Strong US Economic Data
  Indonesia Surprises Markets with Interest Rate Cut Amid Currency Pressure
  US Futures Rise as Investors Eye Earnings, Inflation Data, and Wildfire Impacts
  US Gas Market Poised for Supercycle: Bernstein Analysts
  Mexico's Undervalued Equity Market Offers Long-Term Investment Potential
  Gold Prices Fall Amid Rate Jitters; Copper Steady as China Stimulus Eyed
  Goldman Predicts 50% Odds of 10% U.S. Tariff on Copper by Q1 Close
  Stock Futures Dip as Investors Await Key Payrolls Data


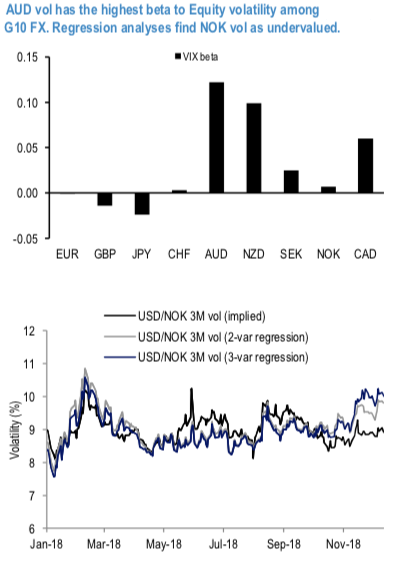
Contemplating the 1stchart, we highlight that AUD is the G10 FX volatility showing the highest sensitivity to the VIX, a specific which clearly manifested itself in early December. Investors interested in participating in a calmer year-end could consider tactically selling AUD vol for playing a lower VIX level over the next few weeks. Based on the same analysis, NOK vol is one of the least exposed to moves in the VIX. Given the sensitivity of the currency to Oil prices, in the bottom chart (zooming on 2018 data) we compare USDNOK implied vol with two fair value regressions, one using the two factors described above, one incorporating Oil volatility as a third regressor. NOK volatility is undervalued in both (2- and 3-factor) regressions by around 1vol, having failed to react to a sharp rise in Oil volatility (to which it is positively exposed) in early November.
The observations favour considering a long USDNOK / short AUDUSD vol trade as a RV implementation for playing a further mean-reversion lower in VIX over the next few weeks. 1y z-score for short-dated implied vols points to the cheapness of USDNOK vol relative to AUDUSD vol.
At present, the carry of the RV structure would be modestly negative (refer 2ndchart), but we stress again that the motivation of the trade would be tactical, playing in a hedged format a drop of implied/realised AUDUSD volatility on the back of a lower VIX level.
We now aim at selecting the strikes so that the RV trade above can exhibit a controlled downside risk profile. The comparison of implied and realized spot/vol correlation, measured historically over 5-yrs, offers limited guidance for strikes selection. We turn to the empirical analysis and analyse historical performance across all combinations of (3M) ATM, 25-delta calls and puts for both the long and short legs (daily delta-hedging assumed). Unsurprisingly short AUD put / USD call structures command the most attractive vol, based on the 5-year empirical backtest.
Explosive unwinds are less of a concern nowadays. With deterioration of value of AUD carry and with RBA being on a back foot, AUD has lost its old high-beta shine. AUD China / commodity linkages continue to pose a vol risk but the last week IMM positioning report has shown that the USD positioning extended to the longest net level since 2015 while AUD positioning found itself on the opposite side of the spectrum at more than 1.5 sigma below 3y average on net leaving us fairly comfortable with fading AUDUSD put side vols.
From the 3rdchart, we see that the choices of USD put /NOK calls and ATM are associated with the most attractive return profiles, although one could argue that the long USD call / NOK put position (more expensive premium-wise due to the skew) could offer a better protection for offsetting the short-vol leg were risk-off to resume.
Trade recommendations:
We activate a long position in 3M ATM USDNOK straddle @8.5/8.75 vol indic vs. short a 3M 25delta AUD put / USD call @8.5/8.7 vol indic, in vega neutral notional, spot ref USDNOK 8.5634, AUDUSD 0.7227.
Beyond the technical indicators suggesting the implementation of this RV trade, we leverage on the long USDNOK vol leg as a possible hedge trade in case of renewed political tensions in the Euro-area.
The short-vol leg allows keeping our vol book nicely exposed to the themes which favoured the success of the first trade above. Courtesy: JPM
Currency Strength Index: FxWirePro's hourly AUD spot index is flashing at -58 levels (which is bearish), hourly USD spot index was at -16 (mildly bearish) while articulating at (11:20 GMT).
For more details on the index, please refer below weblink: http://www.fxwirepro.com/currencyindex


