


 FxWirePro: GBP/AUD drifts lower after BOE rate decision
  NZDJPY Bullish Rebound: Buy Dips as EMAs Align for 97 Target
  US Magnificent 7 Stocks Trend Score: Amazon & Microsoft Hit Extreme Bullish (+100) as Meta Drops to -100 — Key Resistance & Support Watchlist
  FxWirePro: USD/CNY dips to hit three year low,scope for further downside
  FxWirePro: GBP/AUD bears maintain upper hand
  US Magnificent 7 Stocks Trend Score: Amazon & Microsoft Hit Extreme Bullish (+100) as Meta Drops to -100 — Key Resistance & Support Watchlist
  FxWirePro- Major Pair levels and bias summary
  FxWirePro- Woodies pivot (Major)
  FxWirePro: AUD/USD gains some ground but outlook is bearish
  FxWirePro: USD/CAD retreats after Canada posts stronger-than-expected GDP growth
  FxWirePro- Major Crypto levels and bias summary
  FxWirePro- Woodies pivot (Major)
  FxWirePro:USD/JPY climbs back above 160.00 after BOJ rate decision
  FxWirePro- Major Pair levels and bias summary
  AUDJPY Volatile After Massive Sell-Off: Sell Rallies at 113, Targeting 110 as Bearish Momentum Surges
  AUD/JPY Slips Below 112 as BOJ Intervention Sparks Bearish Momentum: Sell the Rallies
  Major FX Action Bias & US Market Sentiment: NZD/USD (Extremely Bullish) & AUD/USD (Bullish) Watchlist


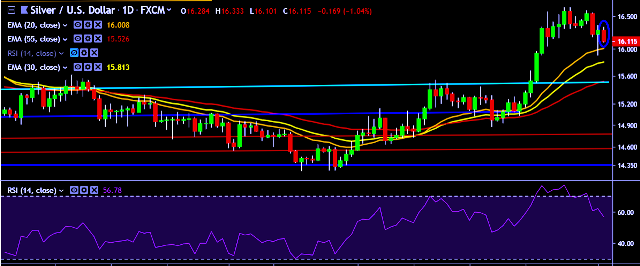
- XAG/USD is currently trading around $16.12 marks.
- It made intraday high at $16.33 and low at $16.10 levels.
- Intraday bias remains bearish for the moment.
- A daily close above $16.57 will test key resistances at $16.68, $16.80 and $16.97 marks respectively.
- On the other side, a daily close below $16.22 will take the parity down towards key supports at $15.90, $15.70, $15.47 and $15.40 marks respectively.
- Important to note here that 20D, 30D and 55D EMA heads up and confirms the bullish trend in a daily chart.
We prefer to take short position on XAG/USD around $16.15, top loss at $16.35 and target of $15.92/$15.70.


