FxWirePro: Thai baht trades marginally higher against U.S. dollar, short term trend reversal likely
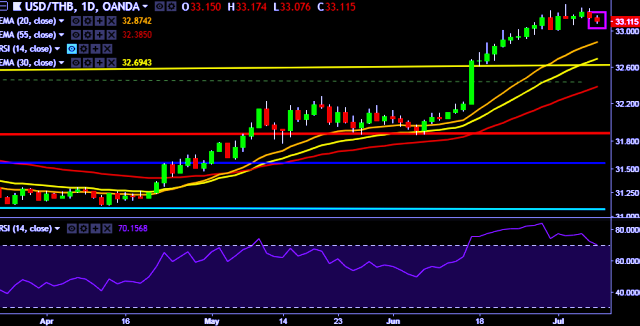
USD/THB is currently trading around 33.11 marks. It made intraday high at 33.17 and low at 33.07 marks. Intraday bias remains bearish till the time pair holds key resistance at 33.30 mark. On the top side, key resistance…
It made intraday high at 33.17 and low at 33.07 marks.
Intraday bias remains bearish till the time pair holds key resistance at 33.30 mark.
On the top side, key resistances are seen at 33.30, 33.48 and 33.78 marks respectively.
Alternatively, a daily close below 33.02 will drag the parity down towards key supports around 32.90, 32.66 and 32.50 marks respectively.
Important to note here that 20D, 30D and 55D EMA heads up and confirms the bullish trend in a daily chart. Current downside movement is short term trend correction only.
We prefer to take short position in USD/THB around 33.12, stop loss at 33.20 and target of 33.02/32.90.