


 FxWirePro: USD/ZAR gains as stronger dollar outweighs upbeat South Africa's trade surplus
  AUDJPY Volatile After Massive Sell-Off: Sell Rallies at 113, Targeting 110 as Bearish Momentum Surges
  FxWirePro: GBP/AUD bears maintain upper hand
  FxWirePro- Major Crypto levels and bias summary
  FxWirePro- Major Pair levels and bias summary
  FxWirePro: USD/CAD retreats after Canada posts stronger-than-expected GDP growth
  AUD/JPY Slips Below 112 as BOJ Intervention Sparks Bearish Momentum: Sell the Rallies
  FxWirePro: GBP/NZD remains weak, eyes 38.2%fib support
  FxWirePro- Woodies pivot (Major)
  NZDJPY Retreats on Yen Strength – Bearish Setup Targets 90 After Hitting 92.75 Low
  Major European Indices Score Extremely Bullish: DAX Eyes 26000, CAC Targets 8600, FTSE100 at 11000 – Key Levels to Watch
  Nikkei Surges Past 65,000 on Suspected Yen Weakness: Tech Giants Like Advantest and NEC Lead Explosive Gains
  FxWirePro- Woodies pivot (Major)
  JPY Currency Meter Signals: NZDJPY Bullish (+25) vs CHFJPY (-100) – These Pairs Could Move Next
  FxWirePro- Major Crypto levels and bias summary
  FxWirePro: AUD/USD gains some ground but outlook is bearish


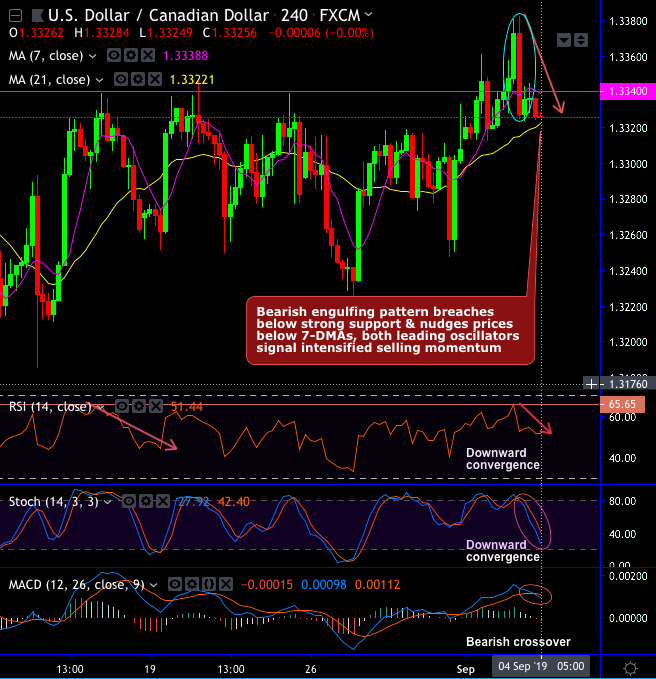
Technical Chart and Candlestick Patterns: Both USDCAD minor and major uptrends test trendline supports, consequently, attempt to bounce back above DMAs and EMAs.
We trace out candlesticks such as dragonfly doji and bearish engulfing patterns on both daily and monthly plotting.
Dragonfly doji occurred at – 1.2463 (on monthly), and at 1.3241 (on daily) and bearish engulfing at – 1.3123 and 1.3086 levels (on monthly), at 1.3327 levels on the daily chart that nudges prices below 7DMAs.
Hence, there has been the tight tussle between bulls and bears, while both leading indicators signal overbought pressures on both timeframes.
On a broader perspective, the major uptrend spikes through uptrend line (refer monthly chart), the current price hovers around 21-EMAs as both momentum & trend indicators edgy on this timeframe but still in bulls' favour on minor trend.
Hence, the prevailing uptrend is most likely to prolong further if it holds support of the uptrend line and 21-EMAs.
Trade Tips: On trading perspective, at spot reference: 1.3319 levels, we advise tunnel options spreads with upper strikes at 1.3338 and lower strikes at 1.3307 levels.
On hedging grounds, contemplating above technical factors and BoC’s monetary policy that is scheduled for this week, we advocate initiating longs in USDCAD futures contracts of next month tenors (i.e. September’19 delivery) as further upside risks are foreseen and simultaneously, shorts in futures of November’19 delivery not disregarding the CAD’s strength amid the prevailing global geopolitical risks. Thereby, one can directionally position in their FX exposures. The directional implementation of the same trading theme by further allow for a correlation-induced discount in the options trading also if you choose strikes appropriately.


