
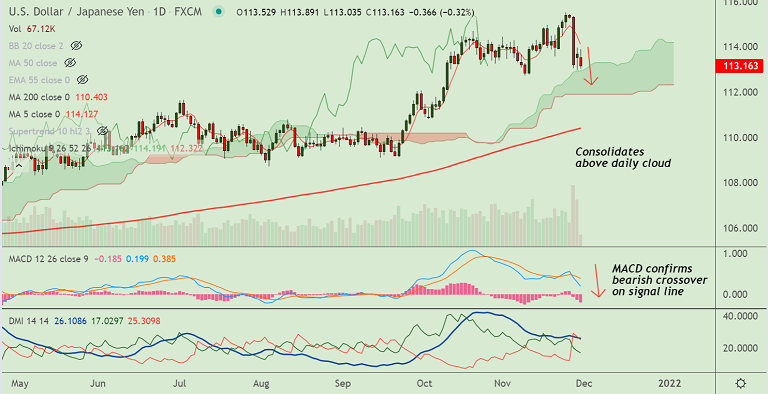
Chart - Courtesy Trading View
Technical Analysis: Bias Bearish
GMMA Indicator
- Near-term moving averages have turned bearish on the daily charts
- Near and long term moving averages are strongly bearish
Ichimoku Analysis
- Price action is consolidating above the daily cloud
- Chikou span is biased lower and may drag the pair lower
Oscillators
- Stochs and RSI are sharply lower, RSI is below the 50 mark
- Momentum is strongly bearish on the daily charts
Bollinger Bands
- Bollinger bands are wide suggesting high volatility
Major Support Levels: 113.06 (55-EMA), 112.93 (Cloud top)
Major Resistance Levels: 114.13 (5-DMA), 114.44 (200H MA)
Summary: USD/JPY trades with a strong bearish bias. Price action is currently consolidating above daily cloud. Break below cloud will drag the pair lower.


