


 FxWirePro: GBP/NZD remains weak, eyes 38.2%fib support
  FxWirePro- Major Crypto levels and bias summary
  FxWirePro: AUD/USD gains some ground but outlook is bearish
  US Magnificent 7 Stocks Trend Score: Amazon & Microsoft Hit Extreme Bullish (+100) as Meta Drops to -100 — Key Resistance & Support Watchlist
  FxWirePro: USD/CNY dips to hit three year low,scope for further downside
  FxWirePro- Woodies pivot (Major)
  FxWirePro: GBP/AUD bears maintain upper hand
  US Magnificent 7 Stocks Trend Score: Amazon & Microsoft Hit Extreme Bullish (+100) as Meta Drops to -100 — Key Resistance & Support Watchlist
  AUDJPY Volatile After Massive Sell-Off: Sell Rallies at 113, Targeting 110 as Bearish Momentum Surges
  FxWirePro- Woodies pivot (Major)
  NZDJPY Bullish Rebound: Buy Dips as EMAs Align for 97 Target
  FxWirePro: USD/CAD retreats after Canada posts stronger-than-expected GDP growth
  JPY Currency Meter Signals: NZDJPY Bullish (+25) vs CHFJPY (-100) – These Pairs Could Move Next
  FxWirePro- Major Pair levels and bias summary
  Major FX Action Bias & US Market Sentiment: NZD/USD (Extremely Bullish) & AUD/USD (Bullish) Watchlist
  FxWirePro: GBP/AUD drifts lower after BOE rate decision


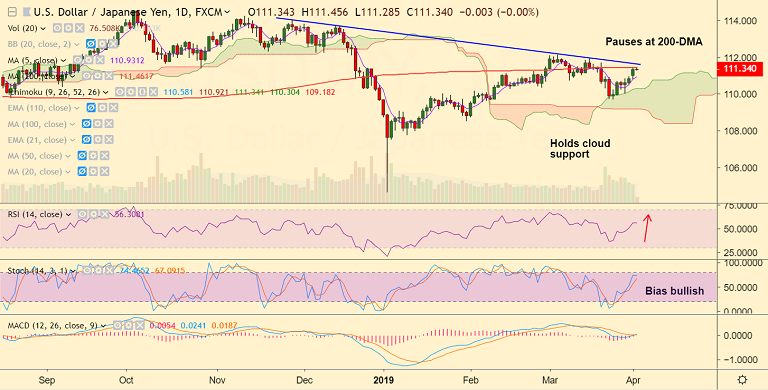
USD/JPY chart - Trading View
- USD/JPY pauses gains at 200-DMA at 111.46, break above required for further upside.
- The major is trading in an extremely narrow range, with session highs at 111.45 and lows at 111.28.
- Technical studies support upside. Stochs and RSI are biased higher. MACD is on verge of bullish crossover on signal line.
- The pair has bounced off cloud support and breakout at 200-DMA eyes 76.4% Fib at 112.21.
- Immediate support lies at 5-DMA at 110.93. Break below cloud to see further downside.
Support levels - 111, 110.93 (5-DMA), 110.30 (cloud top)
Resistance levels - 111.46 (200-DMA), 111.60 (trendline), 112.21 (76.4% Fib)
For details on FxWirePro's Currency Strength Index, visit http://www.fxwirepro.com/currencyindex.


