


 2025 Market Outlook: Key January Events to Watch
  Geopolitical Easing Fuels AUDJPY Rally Toward 115 — Buy Dips at 113
  U.S. Banks Report Strong Q4 Profits Amid Investment Banking Surge
  FxWirePro: USD/JPY gains above 160 level ahead of BOJ policy meeting
  Energy Sector Outlook 2025: AI's Role and Market Dynamics
  Gold Prices Slide as Rate Cut Prospects Diminish; Copper Gains on China Stimulus Hopes
  FxWirePro: EUR/ NZD uptrend loses steam, remains on bullish path
  GBPJPY Coil Tightens: Is a Bullish Break Above 215.60 Imminent?
  FxWirePro: USD/ZAR edges higher, set to stay on back foot
  FxWirePro- Woodies pivot (Major)
  FxWirePro: USD/CAD steadies around 1.3990 ,retains bid one
  US Futures Rise as Investors Eye Earnings, Inflation Data, and Wildfire Impacts
  Wall Street Analysts Weigh in on Latest NFP Data
  UBS Projects Mixed Market Outlook for 2025 Amid Trump Policy Uncertainty
  S&P 500 Relies on Tech for Growth in Q4 2024, Says Barclays
  Peace Dividend Powers NZDJPY Past 93.50 — Bulls Set Sights on 96.15 Target


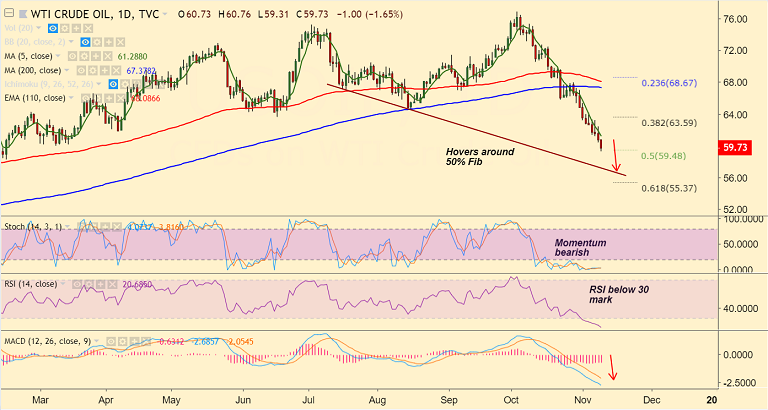
U.S. oil cart on Trading View used for analysis
- WTI extends declines for the 5th straight week, trades 2.11% lower on the day.
- Price has fallen below $60 per barrel and the still-rising crude supply levels to prompt further weakness.
- US Sanctions on Iran came into effect this week and crude prices largely ignored the news.
- Potential for a glut of global oversupply as the US, Russia, and Saudi Arable look to expand production keep pressure.
- Volatility rising on weekly charts, price has dipped below 110-EMA and eyes next major support at 61.8% Fib at 55.37.
- On the flipside, 5-DMA is immediate resistance at 62.25. Break above could see minor upside.
Support levels - 59.48 (50% Fib), 58.11 (Feb 9th low), 57.15 (trendline), 55.37 (61.8Fib)
Resistance levels - 60.56 (110W EMA), 61.28 (5-DMA), 63.59 (38.2% Fib)
For details on FxWirePro's Currency Strength Index, visit http://www.fxwirepro.com/currencyindex.


